Editor's note: Staying ahead of the "smart money" is crucial in today's market...
With inflation concerns and heightened geopolitical tensions looming over stocks, many investors are looking for any advantage to uncover winners amid the economic turmoil.
Such environments motivated Marc Chaikin – founder of our corporate affiliate Chaikin Analytics – to create his one-of-a-kind Power Gauge system in the first place.
He developed a series of proprietary stock indicators, like the industry-standard "Chaikin Money Flow," to give investors an edge on Wall Street – and help them avoid likely losers.
In today's Masters Series, originally from the May 5 issue of the Chaikin PowerFeed daily e-letter, Marc shares the origin story of the key Power Gauge indicator that tracks what the so-called "smart money" is doing...
The Birth of Chaikin Money Flow
Since my first day on Wall Street in the 1960s, I've obsessed over trading volume... I believe it's a "missing link" for success in the markets over the long term.
After all, without volume, a stock wouldn't have any price action. Instead, it would just trade in a straight line.
The act of buying and selling shares sets the market's price.
And to find the best stocks, you need to know what that buying and selling really looks like. It's about "looking under the hood" and getting a sense of what's behind a stock's movement.
After I first got this concept in my head, I couldn't let go of it. I started looking at everything I could find in terms of trading volume...
One of the first stops in my journey was learning about financial writer Joseph Granville in the 1970s. He developed a simple-but-effective idea called "on-balance volume" ("OBV").
Every day, Granville would track a stock's price and note whether it was up or down. He then added or subtracted that day's volume from his OBV line. And he used the data to make calls about a stock's potential path.
It was a great way for me to dip my toes into the concept of trading volume.
But I wanted more...
So I started reading the research published by author and trader Larry Williams. (He's still active today.)
Williams wrote a couple of seminal technical-analysis books in the 1970s. And importantly, he created what became known as the "Williams Accumulation/Distribution indicator."
In short, Williams focused on a stock's closing price versus its opening price. And at the time, it provided a big step forward over other published works on trading volume.
That's when it all really clicked for me.
I used to compute Williams' math by hand using a "Bowmar Brain" calculator...
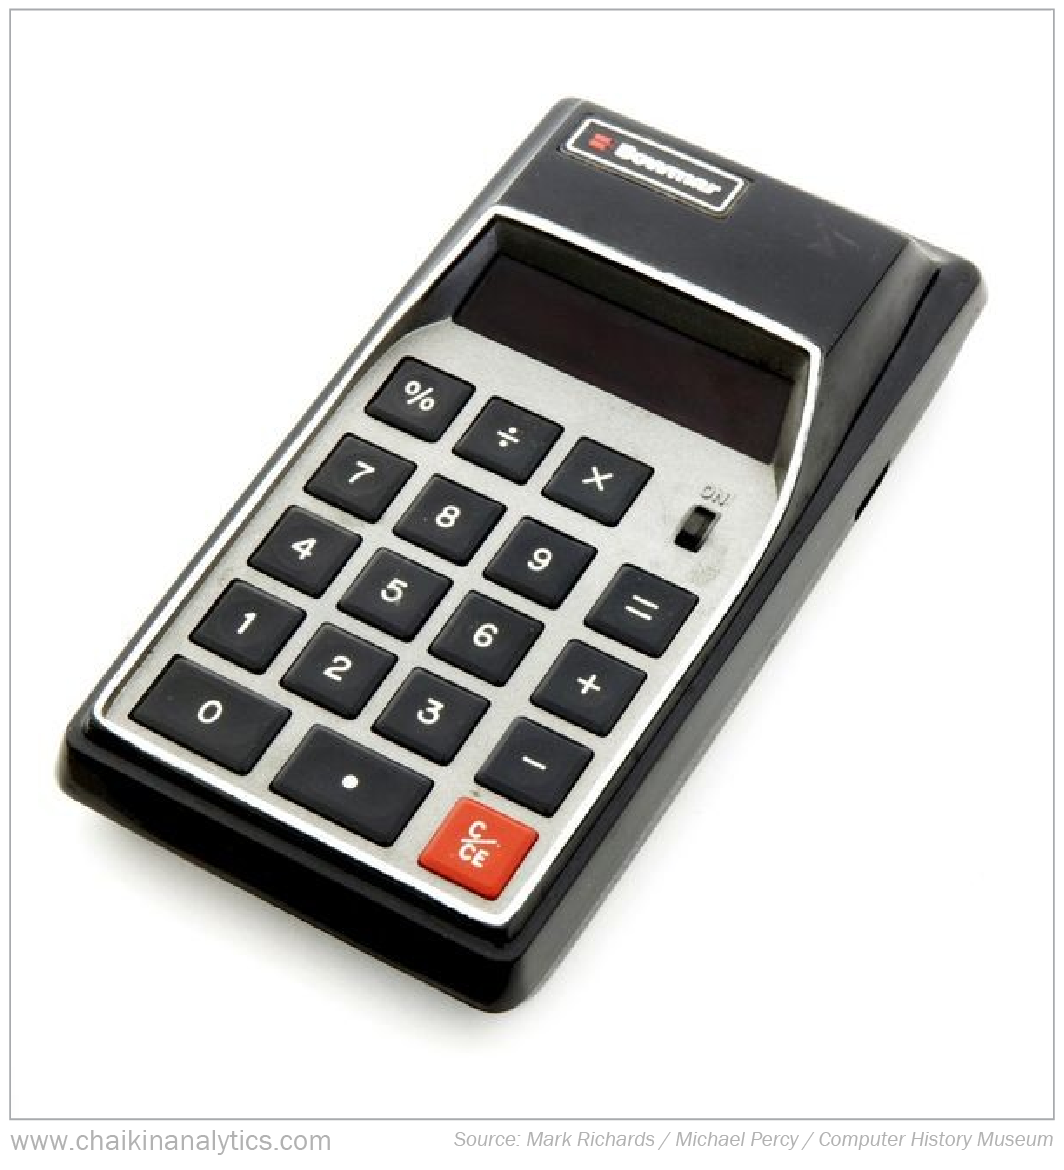
The calculations themselves weren't hard. But collectively, it required a ton of work. And I had to do it every day for each stock I was watching.
The ticker tape never stopped. So I needed to continuously update my calculations. That made trying to get ahead of the market difficult enough.
Then, something happened that changed the trajectory of my life...
Around 1978, newspapers stopped publishing granular price data on stocks. Before that, the New York Times, Wall Street Journal, and other publications had printed the open, high, low, and close prices for stocks every day. And importantly, they also printed the volume.
But for some reason, they all decided (around the same time) that it wasn't necessary anymore.
Frustrated doesn't begin to describe how I felt at the time. I had found the pot of gold at the end of the rainbow. Then, without any input from me, the leprechaun ripped the pot right out of my hands.
The data I needed had vanished.
But I wasn't going to give up. So I set out to create a new formula, similar to what Williams had done.
I knew I could compare a stock's opening price with its average price for the day. And I could do the same thing with the closing price and average price.
That worked – and frankly, it was even better than Williams' method. Then, it dawned on me...
I needed to look at how institutions buy and sell stocks.
Put simply, the real buyers – the market's most powerful players – typically get in toward the end of the day. This idea is the foundation of my Chaikin Money Flow indicator.
That's the short version of how this indicator came to be.
I created it to follow the buying and selling patterns of the so-called "smart money" on Wall Street. And today, it's one of the most important pieces of the Power Gauge for determining which direction a stock might be headed next.
Good investing,
Marc Chaikin
Editor's note: Marc just identified one little-known stock with true "moonshot" potential. With 95 ironclad patents on a potentially life-changing technology under its belt, Marc believes this stock is on the verge of a historic rise.
That's why he just hosted an online presentation to reveal exactly how you can capitalize on this under-the-radar opportunity to rake in massive long-term gains. Click here to catch up on the full details...
Join for free. See how over a million people are taking control of their wealth…