A Recession Might Be Closer Than You Think
Today's record market may run out of steam soon...
With the S&P 500 Index making new highs, it's easy to imagine that the momentum will continue and more new highs will follow. Last Wednesday, my senior analyst, Jeff Havenstein, wrote that a market "Melt Up" is possible.
But the good times won't last forever. If we get a recession, stocks are going to suffer.
And recently, my No. 1 recession indicator flashed a dire warning sign.
Analysts use plenty of indicators to try to predict recessions. The Sahm Rule looks at changes in unemployment. The Conference Board Leading Economic Index uses 10 different measures to "anticipate turning points in the business cycle by around seven months."
My favorite is the yield curve. You've likely heard of this metric... But I like to use it differently than most folks.
The yield curve is the difference between the yields on fixed-income securities maturing at different times. Normally, longer-term bonds have higher yields than shorter-term bonds. That's called a "positively shaped yield curve."
What will happen 10 years from now is always more uncertain than two years from now, so you're supposed to earn a higher yield when you buy longer-term bonds to account for that risk.
But sometimes the yield curve "inverts," and shorter-term securities pay better yields than longer-term ones. This happens when investors expect to see lower interest rates, lower inflation, or even deflation in the near term... These things normally happen only if the economy gets bad.
The inversion of the yield curve is a reliable gauge of recessions. It flashed warnings before the downturns in the early 1980s, the savings and loan crisis of the late '80s and early '90s, the burst of the dot-com bubble, the 2008 housing bust, and even the brief COVID-19 recession in 2020. Over the past six decades, it gave only one false positive (in the mid-1960s). Even then, the economy did slow, though the drop wasn't officially a recession.
The problem with this indicator is that it doesn't tell us when a recession will strike. Once we see a yield inversion, the time until the recession can vary. It can happen in as little as six months or take as long as two years.
The yield curve inverted back in 2022. But we haven't seen a recession yet.
Now, my twist on this metric is to look at the yield curve's un-inversion. That just means finding the moment when long-term rates move back up and become higher yielding than short-term rates.
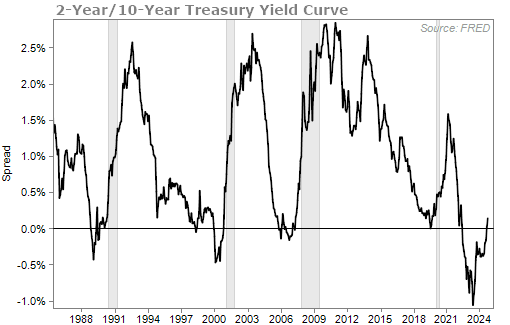
There's an interesting pattern with a lot of these yield un-inversions. Just take a look at how they've preceded the past few recessions (shaded in light gray)...

As you can see, recessions usually strike within just a few months of a yield un-inversion.
Also, long-term yields have remained higher than short-term yields over the past couple of weeks. The curve has officially un-inverted... so we should expect a recession sometime in early 2025.
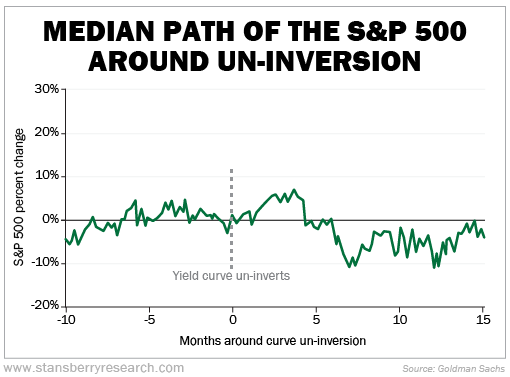
Taking this one step further, the chart below looks at the median result of the S&P 500 after the yield curve un-inverts and a recession strikes within 12 months...

This shows that stocks don't necessarily plummet right away... But returns aren't great five to 10 months later. And historically, they're still in the red even 15 months after the un-inversion.
To be clear, we'll likely see more gains in the near future. I agree with Jeff that we're not at a "euphoric" stage in the market cycle just yet.
But be warned that, in the longer term, those gains are usually wiped out the further you go past the curve's un-inversion.
With this in mind, now is not the time to become so blinded by greed that you take out a second mortgage on your house to buy stocks... It's also not the time to sell everything.
You need to have money in the stock market to keep making a profit as the uptrend continues. But you need to have an exit plan in place for when the tide inevitably turns. And as always, you need to be holding cash to be able to buy great companies on the cheap when the markets do plunge.
My friend Marc Chaikin (of our corporate affiliate Chaikin Analytics) also sees some warning signs in the market. Marc is a Wall Street veteran with more than 50 years of experience. He notes that a signal is currently flashing that has gone off before every big crash of the past two decades. But he believes that the entire market won't suffer...
Marc has created a tool to help everyday investors figure out which sectors will outperform and which ones will be crushed once this shift in the market begins. So if you want to not only understand what's really happening to the market's fundamentals but also protect your wealth, make sure you hear the details.
Click here to watch his presentation.
What We're Reading...
- Did you miss it? Human emotions point to more market gains.
- Something different: All the cars being discontinued next year.
Here's to our health, wealth, and a great retirement,
Dr. David Eifrig and the Health & Wealth Bulletin Research Team
September 25, 2024

