
How the Power Gauge Saw Warren Buffett's Secret Trade
Editor's note: For nearly a year, Berkshire Hathaway was secretly building one of its biggest positions. But as Pete Carmasino of our corporate affiliate Chaikin Analytics explains, this move was visible all along to investors using the Power Gauge. In this piece, adapted from a May 2024 issue of the daily Chaikin PowerFeed e-letter, Pete breaks down what shifts like this look like on the Power Gauge – and why savvy investors should watch closely for similar signals ahead...
Warren Buffett may be 94 years old... but that doesn't mean the investing legend is done making big moves.
And at this time last year, his business, Berkshire Hathaway (BRK-B), was on a secret buying spree. In fact, it accumulated about $6.7 billion of a single company.
Amazingly, Berkshire managed to keep the purchases secret for nearly nine months. Or, at least it thought it did...
You see, the Power Gauge spotted this activity.
Today, I'll explain how the one-of-a-kind system we use at Chaikin Analytics saw that something big was going on. I'll also share how you can use the tool to find similar opportunities...
What the Power Gauge Knew First About This Bullish Switch
If you didn't see it all over the financial media last year, the "mystery" company Berkshire was building a position in is Chubb (CB). It's a Zurich-based property and casualty (P&C) insurer.
Over several months, Berkshire bought nearly 26 million shares of Chubb. That translates to a roughly $6.7 billion position. And as of the end of March 2024, that made Chubb the ninth-largest holding in Berkshire's equity portfolio. And a year later, it still remains in the top 10.
This was huge. And Berkshire kept it a secret as long as it could...
But we can see this move on the one-year price chart of Chubb leading into May 2024. Take a look at the changes to the data from the Power Gauge...
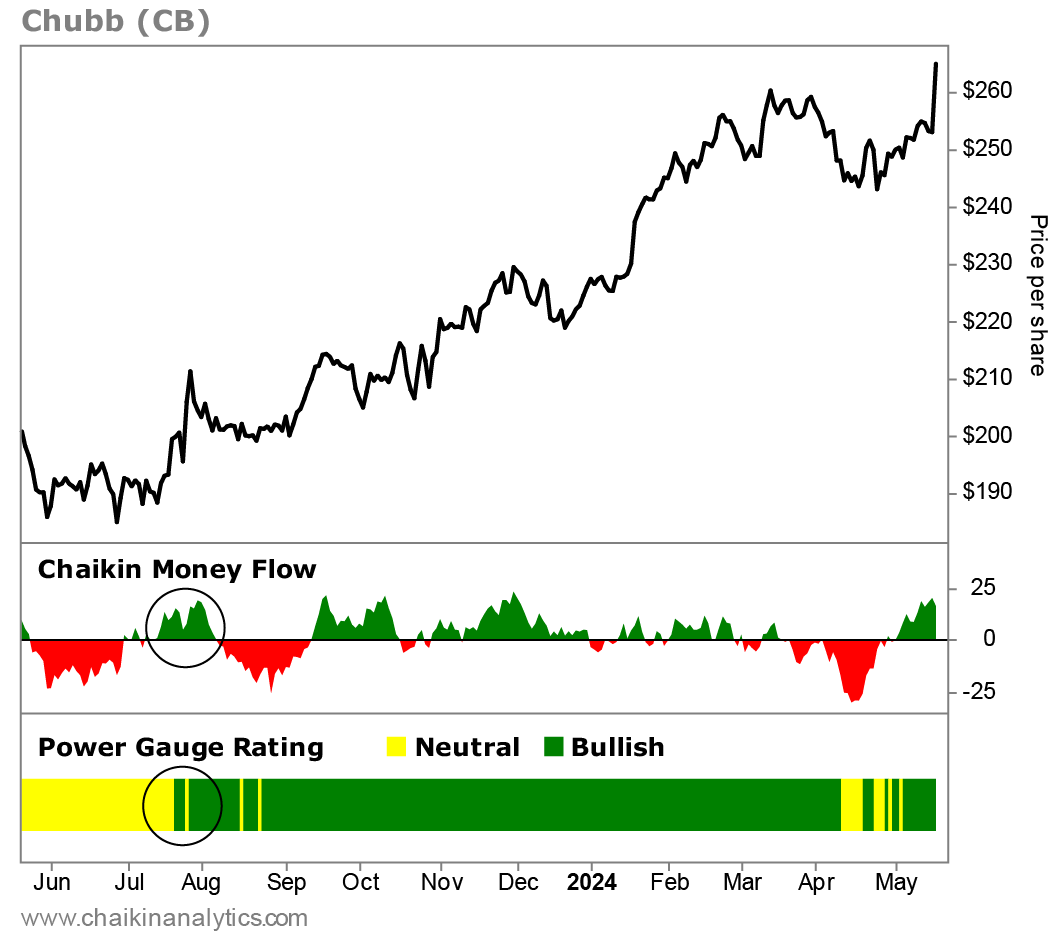
This chart illustrates what makes the Power Gauge so incredible. It's a tool we use at Chaikin Analytics for analyzing the market. It gathers investment fundamentals and technicals into a simple rating of "bullish," "neutral," or "bearish."
Now, there are a few things going on here...
First up, I want to draw your attention to the Power Gauge rating. You'll notice that Chubb earned a "neutral" rating in the first half of July 2023. Then, it turned "bullish."
You'll also notice that the Chaikin Money Flow indicator spiked around the same time. This indicator is important, so let me explain in more detail how it works...
You see, Chaikin Analytics founder Marc Chaikin developed this indicator in the early 1980s as a way to measure the accumulation (buying pressure) versus distribution (selling pressure) of a stock over time.
This indicator ranges from 100 to negative 100. And it's displayed as a green-red oscillator. Green represents net buying pressure, while red represents net selling pressure.
Because of the way the calculation was designed, money-flow persistency (significant regions of green or red over a six- to nine-month period) can be a sign of accumulation or distribution by major institutions that have a disproportionate effect on future price movement.
In more simple terms, the Chaikin Money Flow indicator helps us identify the behavior of large institutional investors – such as pension funds, mutual funds, and hedge funds – without directly tracking their order flow.
That's because large institutions are disproportionately responsible for a "closing effect" on price.
To understand why, envision the behavior of a traditional fund-management company...
The research department determines the firm's overall orientation on specific stocks, decides which opportunities to be long or short, and figures out the rough proportions.
Portfolio managers make allocation decisions for specific funds or portfolios. They send instructions to a trading desk. The trading desk manages specific buy and sell orders to minimize market impact.
Early in a trading session, traders will be less likely to expose large blocks of shares to trade, which can move the market against them.
But as the session nears its close, traders need to be more aggressive in getting their orders filled. So they'll bid stocks higher if they're buying... or accept lower offers if they're selling.
This is a subtle but noticeable "closing effect" that's more present than with retail order flow.
The Chaikin Money Flow indicator measures this closing effect. And it helps indicate the "true" buying and selling pressure of the institutions that move markets most.
Folks, this is an incredible tool you can use to your advantage. And with Chubb, it just so happened that the Power Gauge spotted Berkshire's "smart-money accumulation."
Again, our system flipped to "bullish" on Chubb as the Chaikin Money Flow indicator was turning much higher. It's a powerful combination.
Put simply, when the Power Gauge spots a big change in a stock... you want to pay attention.
Good investing,
Pete Carmasino
Editor's note: Marc Chaikin warned his subscribers about this year's crash nearly two weeks before it unfolded. Now, he says something even more dangerous is brewing – and it could begin as soon as May 9. It's not a recession or dollar collapse. Instead, it's a peculiar threat that could wreck your portfolio... or double it... See his urgent briefing here.
Further Reading
Over the past few months, the risk of stagflation has threatened 100 years of bullish election-cycle data. And while Marc Chaikin remains bullish, he created the Power Gauge for moments just like this – times when investors need "an emergency beacon" to navigate challenging markets... Learn more here.
"History tells us that these 'market ending' events don't always play out like investors expect," Vic Lederman writes. So while investors are fearful of tariff headlines and market uncertainty, now's not the time to run for the hills. Markets tend to rally following bouts of political brinkmanship like this... Read more here.