
A Stock Market Forecast You Won't Believe
A stock market forecast you won't believe... 'This certainly isn't reason to panic'... There's just one 'catch'... Sjug: A new reason to stay bullish on U.S. stocks... Your last chance to get Steve's research at a huge discount...
 What if we told you the boring, blue-chip S&P 500 Index could rally 20%-plus by the end of the summer?
If you're like most folks, you'd probably be skeptical.
But according to our colleague Ben Morris, it's not only possible... history says there's a good chance it could happen. And it has to do with an indicator that should be familiar to regular Digest readers: the 200-day moving average ("DMA").
If you're not familiar, the 200-DMA is just what sounds like. It's the average price of an asset – in this case, the S&P 500 – over the previous 200 days. Averaging prices over many months helps to filter out short-term price volatility, and makes the 200-DMA a useful gauge of the market's long-term trend.
In general, there are two important ideas to keep in mind when looking at this indicator...
First, during bull markets, assets tend to spend most of their time trading above the 200-DMA. During bear markets, they spend most of their time trading below it.
Second is that an asset rarely strays too far from this line in either direction before returning to it... And like a rubber band, the further it goes, the more violent the eventual reversal tends to be.
This is one of the biggest reasons we expected a significant correction early this year...
As we explained in the January 17 Digest...
The following chart of the S&P 500 Index shows how it works. As you can see, since stocks moved back above this trendline following the financial crisis in 2009, they have rarely traded below it...
You'll also notice that whenever stocks have rallied significantly above this line, they have eventually come back to "test" it – touching it or even moving below it briefly – before continuing higher...
Right now, the S&P is nearly 12% above the 200-DMA. And it hasn't "tested" it in more than a year. This is unusual... In fact, the market has only been this stretched above the 200-DMA three other times since the rally began. And each of those cases preceded a sharp correction over the next few months.

That's exactly what happened this time as well.
The market peaked less than two weeks later, and has been trending lower ever since. And on Monday, the S&P 500 officially closed below its 200-DMA for the first time in nearly two years.
As we've discussed, this doesn't guarantee that the correction is over...
In fact, given how "stretched" the market was above the 200-DMA earlier this year, it wouldn't be unusual to see it overshoot on the downside as well.
But Ben's research is as surprising as it is clear: History says any further declines are likely to be reversed quickly... and stocks could absolutely soar over the next several months. As he explained to his DailyWealth Trader subscribers on Tuesday...
Going back 60 years, we'll look at every time the S&P 500 broke below its 200-DMA for the first time in more than a year. And we'll see what happened in the following year...
In the table below, you'll see every similar occurrence since 1957 and the returns over the year that followed. Below the table, you'll see the average and median returns, along with the percentage of time the index was positive for that timeframe...

As you can see, the results are impressive...
While you might assume this occurrence would be a bearish signal, the market has actually performed relatively well over the next 12 months on average. More from Ben...
We see one really bad result in the months following the 1962 breakdown. The S&P 500 dropped 16% more (in addition to what it dropped prior to breaking its 200-DMA) in the following two months... and it continued lower through the six-month mark. Then it rallied and closed just 1% lower by the 12-month mark.
Aside from that, though, the results were mostly positive – average gains of 4% after three months, 7% after six months, and even more by the one-year mark. Between 67% and 75% of the time, returns were positive.
This certainly isn't reason to panic.
There's just one 'catch'...
You see, the S&P 500 hadn't just traded above its 200-DMA for one of the longest periods in history. As we mentioned earlier, it was also more stretched above its 200-DMA than almost any other time in history as well.
If you're like us, you probably assume this extreme would lead to lower-than-average returns over the next 12 months.
But you'd be wrong. In fact, according to Ben's research, the opposite is true...
The S&P 500 stretched more than 10% above its 200-DMA within three months of breaking below it just three other times: 11% above in 1985, 10% in 1996, and 15% in 1998.
Here are the returns following those three 200-DMA breakdowns...

They're among the three best results for most timeframes. And they are the three best results for six, nine, and 12 months out.
At three months out, the average return was 14%. At six months out, the average return was 23%. And at one year out, the average return was 34%.
Of course, we can't be certain that history will play out the same way this time...
And like us, Ben would never recommend basing your investment decisions on a single indicator or historical study alone.
But this isn't the only reason he remains bullish today. In this morning's edition of DailyWealth Trader, Ben and research analyst Drew McConnell shared three more reasons stocks could soar over the next six to 12 months...
Over the past couple of days, we've seen lots of bullish signs...
For one, sentiment toward stocks is extremely bearish right now. On Monday, the put/call ratio reached an extreme bearish reading above 1.2. And the American Association of Individual Investors Sentiment Survey shows the most pessimism toward stocks since September.
Extreme sentiment is a contrarian indicator. So when a lot of folks turn bearish, it's a bullish sign.
Next, they noted that yesterday's big market rebound is an incredibly positive sign...
Yesterday's price action was impressive. After a terrible start to the day (the S&P 500 was down as much as 1.6%), buyers entered the market in force. Stocks rallied all day and closed up 1.2%. This sort of reversal, right near the low of a big drop, is a bullish sign.
And finally, they shared the results of another remarkable study from our friend Jason Goepfert, publisher of the excellent SentimenTrader service...
Jason ran a different historical study yesterday. Going back 70 years, he looked at times when the S&P 500 experienced a cluster of volatility. Specifically, he looked at times when the index moved by 1% or more in at least eight of the prior 10 trading days.
With 27 "volatility clusters" in the study, the S&P 500's average return over the next year topped 20%. Like the results of our study, his results were extremely bullish.
We're in a long bull market. And as we've explained, volatility is normal. It's also normal for pessimism to grip traders during this kind of volatility.
What isn't normal is the opportunity for 20%-plus gains in the coming year. So we suggest you take advantage.
Regular readers won't be surprised to hear our colleague Steve Sjuggerud remains bullish as well...
We've discussed Steve's bullish "Melt Up" thesis in detail many times, so we won't rehash it all here. In short, he remains as convinced as ever that the bull market will continue for up to two more years before a real bear market arrives.
But Steve has found one more surprising reason to remain bullish today: Stocks are no longer expensive. As he explained in our free DailyWealth e-letter last Thursday...
Two things directly cut down the main measure of "value" in the stock market – the price-to-earnings ratio...
- The correction in the markets, and
- The tax cuts from President Trump.
The price of stocks – the top half of the ratio – went down in the correction. Meanwhile, earnings – the bottom half of the ratio – are expected to go up dramatically, largely thanks to the tax cuts. (Over the next 12 months, the earnings of companies in the S&P 500 Index are expected to rise by 27%.)
In other words, Steve says both the numerator and the denominator of the most common measure of stock market value have improved dramatically over the past few months. In fact, it now sits almost exactly at its 25-year average. More from Steve...
You can easily see the great peak in valuations around the time of the dot-com frenzy. Stocks were the most expensive they've been in the last 25 years. (Actually, ever.) And you can easily see the great bottom in valuations in 2009. Stocks were the cheapest they've been in the last 25 years.
So what does this measure of stock market value tell us now?
Today, we are exactly in the middle... Stocks are trading right at their average valuation over the last 25 years. They are not cheap – but they're not expensive.
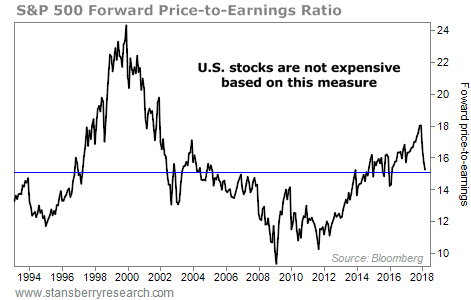
To be clear, this chart is using earnings estimates for next year based on the recent tax cuts...
And Steve admits that there is no guarantee they will come true. But if they're anywhere close to correct, stocks could absolutely soar from here...
I'm sure you can list plenty of reasons why stocks could keep falling. But now you'll have to take the main measure of value off your list... Prices have fallen. Earnings are rising. Therefore, the price-to-earnings ratio is much lower today than it was at the start of this year...
Stocks are now trading at the same forward P/E ratio they were trading for in March 2016. The S&P 500 soared 46% (in total return) between then and January this year. That's 46% in less than two years... from the same starting point in valuation we have today.
As of today, stocks are neither expensive nor cheap, based on the most classic measure value. Don't let 'em tell you any different... And don't let valuation be the reason that you are not invested. That reason is now no longer valid...
Again, Steve remains incredibly bullish on U.S. stocks...
But he believes the opportunity in Chinese stocks is even better.
You see, unlike the long bull market in the U.S., the bull market in China is just beginning. Steve believes it will run for years... And thanks to recent fears of a trade war, many of his top recommendations are temporarily "on sale" today.
In other words, if you missed out on the huge gains in these stocks over the past 18 months, you may never have a better chance than this.
In fact, to make sure every interested reader has the opportunity to profit, Steve agreed to open up his exclusive True Wealth China Opportunities service to new subscribers at the biggest discount we've ever offered.
But this limited-time offer closes at midnight Eastern time tonight. Which means if you're interested in joining, we must hear from you now. Click here for all the details on this special offer.
New 52-week highs (as of 4/4/18): none.
A quiet day in the mailbag. Have the correction and "trade war" fears receded... or is your portfolio doing too well for you to care? Let us know at feedback@stansberryresearch.com.
Regards,
Justin Brill Baltimore, Maryland April 5, 2018