
Another Major Reason to Remain Bullish Today
Another 'Melt Up' warning... Another major reason to remain bullish today... 'One of the most valuable pictures you'll see all year'...
 Last week, we shared our colleague Steve Sjuggerud's latest thoughts on stocks...
In short, Steve says the "Melt Up" isn't over yet. He notes that none of his trusted long-term indicators are flashing warning signs, and says it just doesn't "feel" like a market top at this time.
But he also says that if you're going to remain invested for the explosive final phase of this bull market, you must understand two critical things.
First, bouts of volatility – like the one we experienced earlier this month when the major U.S. indexes plunged 10% in a matter of days – will become more frequent as the Melt Up rolls on.
And second, the future could be downright ugly once the Melt Up ends. Steve believes stocks could be a losing bet over for the next seven to 10 years.
What this means is that you absolutely must follow proper risk-management strategies, like diversifying your portfolio across uncorrelated assets, using sensible position sizing, and following trailing-stop losses.
Folks who ignore this advice are sure to regret it... They'll panic and sell their stocks during one of the inevitable corrections and miss out on the biggest gains. Or worse, they'll hold on too long and suffer catastrophic losses when the Melt Up ends and the "Melt Down" begins.
Unfortunately, we know from experience that most folks won't listen...
Most novice investors don't really "get it" until they suffer a devastating loss for themselves. But we've also heard from a handful of subscribers over the years that our repeated "nagging" eventually spurred them to take action.
So forgive us for nagging, but if we can save even one more subscriber from making these mistakes, it's well worth the effort.
Of course, ignoring these strategies is just one of the many ways inexperienced investors can blow themselves up...
Among the most dangerous ways is using margin... That is, borrowing money to buy stocks and other assets. And it seems many folks are doing just that today. As the Wall Street Journal reported this morning...
Retail and institutional investors have borrowed a record $642.8 billion against their portfolios, according to the Financial Industry Regulatory Authority, as they try to pocket bigger gains by ramping up their exposure to stocks...
Using a margin loan, an investor... would pledge all or part of a portfolio of stocks and bonds as collateral to buy other securities. If the value of the collateral shrinks enough, which tends to depend on the mix of investments that are pledged, the bank can demand repayment. If the margin call isn't met, the securities backing the loan are sold and the borrower is responsible for any remaining balance.
So-called net margin debt was worth 1.31% of the total value of the New York Stock Exchange last year, according to Goldman Sachs data stretching back to 1980, eclipsing the previous peak of 1.27% reached in the buildup to the tech bubble in 2000.
And the Journal highlighted the troubles of one poor trader in particular...
Joe Diaz, a trader who lives in Yuma, Ariz., watched as his portfolio fell as much as $25,000 in early February, forcing him to add more money into his account to satisfy a margin call as the stocks he bought using margin... tumbled alongside the broader indexes...
"I was so bullish that I went all in," said Mr. Diaz. Confident that markets would recover, he deposited $2,500 into his account to satisfy a margin call on Feb. 8. "The next day, the market ripped higher and I breathed a sigh of relief," he said.
Now, margin can be beneficial when used appropriately and conservatively...
For example, two of our options-trading services – Stansberry Alpha and Dr. David Eifrig's Retirement Trader – often employ margin to safely boost returns.
But using margin to go "all in" on stocks is guaranteed to end in disaster. When the Melt Up finally ends and the Melt Down begins, folks like Joe Diaz will be wiped out.
Whatever you do, don't be one of them.
But Steve isn't the only analyst who believes the bull market will continue awhile longer...
Our colleague Ben Morris also remains bullish today. Like Steve's long-term indicators, Ben points to a simple yet powerful chart that continues to give the "all clear" today: the benchmark S&P 500 Index and its 200-day moving average ("200-DMA"). As he explained to his DailyWealth Trader subscribers last week...
A lot of professionals like to use the 200-DMA to size up a market's long-term trend. It works by collecting an asset's closing prices from the past 200 days, then taking the average of those prices. This produces a chart line that "smoothes out" market volatility.
You need to consider two main things when looking at the 200-DMA... The first is that during bull markets, assets tends to spend most of their time above the 200-DMA. During bear markets, they spend most of their time below it.
The second thing is even more important. This is what we're looking at today... The 200-DMA itself is the long-term trend. And it acts like a magnet. Whether it's moving higher or lower, assets tend to have a hard time going in the opposite direction for long...
If you're not familiar with the 200-DMA, this is what it looks like plotted on a five-year chart. You can see that it doesn't jolt around like the S&P 500 does. And it rarely changes direction...
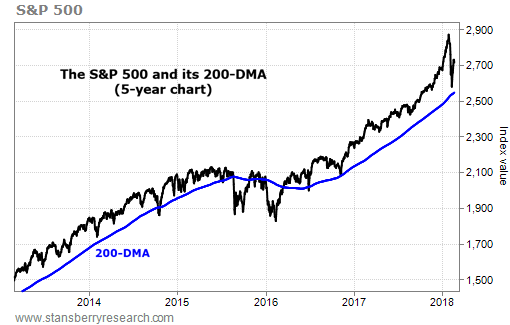
This means that the 200-DMA can be a powerful long-term timing tool...
Ben's research suggests you want to own stocks so long as the 200-DMA is rising, and sell your stocks when it starts to fall. More from the issue...
In order to weed out the insignificant direction changes, I only counted the shifts in which the 200-DMA rose or fell every trading day for a full month.
In the last 35 years, these direction changes have only happened 18 times. Some of these changes were insignificant... But others preceded huge bull and bear markets.
In the 35-year chart below, I've marked these 18 occasions. This could be one of the most valuable pictures you see all year. The red arrows show "sell points" – times when the 200-DMA turns lower for at least a month. And the green arrows show "buy points" – times when the 200-DMA turns higher for at least a month...
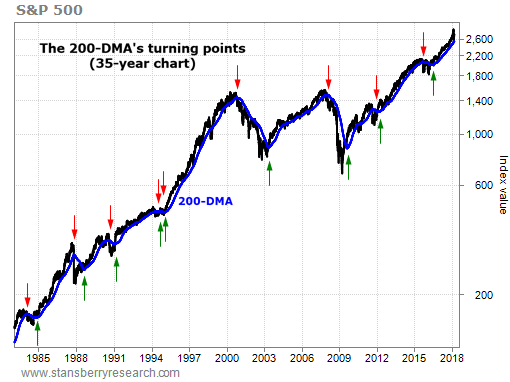
The results of this simple study may surprise you...
As Ben noted, simply buying stocks at the green arrows and selling at the red arrows would have produced remarkable returns...
Here's how you would have done if you put $10,000 into the S&P 500 on December 31, 1982 and used this simple buy and sell system. Keep in mind, this doesn't include dividends...
Aside from one little fake out in 1994 (when the 200-DMA turned higher for one month and one day), every buy point resulted in a double-digit gain or more.
The average holding period for all 10 buys is two years and nine months. And the average annualized return is 9.1% (again not including dividends).
You would have multiplied your money 22-fold, turning $10,000 into more than $220,000 – a 2,104% return. That's a fantastic result.
Not only would this system have kept you in the market for the biggest rallies, but it would have also kept you out of the market for the biggest declines. More from Ben...
Here's what you would have missed by selling your stocks at the red arrows, rather than holding all the way through...
You would have missed some single-digit gains and a couple of 17% gains. But you also would have missed the worst part of two brutal bear markets – 32.5% of the dot-com bust and 27.3% of the financial-crisis bust.
That's a huge amount of avoided stress. Plus, it would have freed up your cash for other opportunities.
Most important, this system would've trounced a simple "buy and hold" strategy over the same time period...
A buy-and-hold strategy would have delivered a 1,831% gain – 272 percentage points less than our 200-DMA buy-and-sell strategy. And you would have had your money tied up in stocks for an additional 7.5 years (four of which were no fun at all).
To be clear, Ben doesn't recommend buying or selling stocks based on this system alone...
Though, as he noted, you could certainly do a lot worse.
Rather, he recommends using the 200-DMA as a guide for your trading and investing decisions. And today, it says the bull market is likely to continue...
As you saw in the first chart, the 200-DMA is still on the rise. It's nowhere near a turning point. So we know we still want to own stocks and trade with a bullish outlook.
We always take precautions with our trading in DailyWealth Trader. We use intelligent position sizing and stop losses. We hedge our bullish positions with strategies like short selling and pairs trading. And we trade assets that aren't correlated to the broad stock market (like precious metals and currencies).
We'll let you know when something changes. But as long as the trend is up, we have little reason to change our medium- or long-term outlook.
It's a bull market. So stay long.
If you're interested in more great insight and trading ideas from Ben and the DailyWealth Trader team, click here to learn more about a 100% risk-free trial subscription.
New 52-week highs (as of 2/23/18): Amazon (AMZN), First Trust Nasdaq Cybersecurity Fund (CIBR), JPMorgan Chase (JPM), New York Times (NYT), and Okta (OKTA).
In today's mailbag, more feedback on Stansberry's Credit Opportunities... and several readers respond to Porter's latest "lesson" from the Friday Digest. Send your notes to feedback@stansberryresearch.com.
"I completely agree with Christopher Karpenko's comments about Stansberry's Credit Opportunities. I am also building an IRA around these bond investment opportunities plus the insurance companies Porter talks about in [Friday's Digest]. There is nothing I appreciate more than holding all the best insurance companies, as identified in the Insurance Monitor, and augmenting that with recommendations from Credit Opportunities." – Paid-up subscriber Stan Wells
"Christopher took the words right out of my mouth. Although I would have added one more 'PLEASE' – for the love of God, [PLEASE] don't shut down Credit Opportunities!!! Thank you." – Paid-up subscriber B.T.
"Just a short note to say thanks for your research and recommendations in Stansberry's Credit Opportunities. I highly value the advice and the premise of investing in distressed but reasonable risk corporate bonds is very solid. I look forward to each of your issues and allocate a significant portion of my investment to this strategy. Keep up the good work!" – Paid-up subscriber Tim Hibbing
"I am glad to hear my [Stansberry's Credit Opportunities] lifetime subscription is not to be short-lived! I have enjoyed tremendous success and have 1/3 of my portfolio in SCO, 1/3 in Steve's aggressive stuff, and 1/3 third in fun trading Doc's Retirement Trader portfolio... who knew options could be so much fun!" – Paid-up subscriber Mike Kilmartin Sr.
"Porter, as I was reading your [Friday] Digest I started to be alarmed when one of the comments by one subscriber began to worry you might close Stansberry's Credit Opportunities. I was glad to hear that you don't plan on shutting it down any time soon.
"I have been an avid follower and investor in the bonds since you started the letter. It has been extremely rewarding as you know. I invest one half of my retirement funds in bonds and the balance using your other letters. I admire the success you are having with the bonds as they have been very rewarding for me.
"Thank you. I look forward to each monthly letter even when we don't have a new bond to place funds in. Just keeping an eye on the previous ones as they come into purchase range. Thank you againPorter for this success." – Paid-up subscriber Ron Handy
"Just had to tell you my very first IRA was Selected American Shares, managed by Sheldon Davis. Think I've got the right name. I've still got the fund, held over 25 years." – Paid-up subscriber Lillian Vickers
"Dear Porter, After 2008, I made a commitment to take full responsibility for my retirement portfolio. I was not going to rely on my brokerage house's passive investing strategies. In 2008, my retirement portfolio was growing, crashed and has since recovered. After much review, I decided that Stansberry Research was going to be my teacher. As a paid-up Flex Alliance member, I have learned much. My primary teachers have been you, Doc Eifrig, and Steve Sjuggerud.
"Your greatest lesson for me Porter, was your work in Stansberry's Investment Advisory on P&C insurance companies. I studied the work of you and your team on insurance companies in general and then studied your P&C selections specifically. I chose a small lot of three equities to put into my 'long term' equities portion of my portfolio. These are positions that I buy and hold generally forever as compared to my gold and speculative positions that I manage with trailing stops... Since making this investment, my returns have been 128%, 67%, and 68% respectively.
"Thank you, teacher, for I have learned and now I teach the value of investing in the best managed P&C companies to my children and eventually my grandchildren. Best Wishes." – Paid-up Stansberry Flex member Mark Ramsey
Regards,
Justin Brill
Baltimore, Maryland
February 26, 2018