When the next correction is coming... And how we'll know five months ahead of time... Introducing the Complacency Indicator... The three stats you must watch... Are we close to a collapse today?...
Editor's note: The market will be closed Monday for Labor Day, as will the S&A offices. So we won't publish the Digest in recognition of the holiday. We'll resume our regular publishing schedule on Tuesday.
 What if we could tell you, with near certainty, when the market was going to collapse?
Everyone says timing the market is impossible... But it's not. And at the end of today's Digest, I'll tell you if we're on the verge of a major correction...
Steve Sjuggerud and his team at True Wealth Systems – Brett Eversole and Rick Crawford – recently undertook a major study to find certain indicators that trigger a drop in the stock market.
They have an immense amount of data and brain power and computing power. (We spend more than a million dollars a year so they have access to the best information.) Using their vast resources, they back-tested more than 25 years of data... And looked at dozens of market indicators.
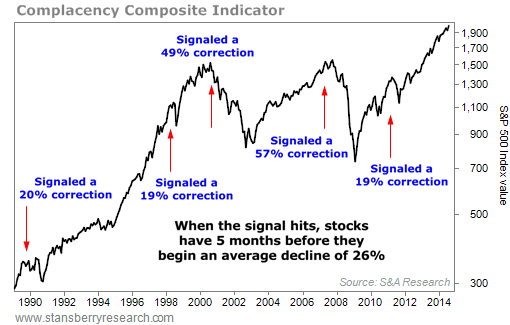
We found three indicators that, when considered together, have signaled seven of the nine stock market corrections of 10% or more over the past 25 years. It missed one correction after the 2002 bottom, when stocks made a quick uptick before falling back down. The other miss was April 2010.
Also, this indicator doesn't give false alarms. Of the seven times it signaled, only one instance led to a correction of less than 10% beginning within 12 months... And the market fell 8.4% that time.
We've taken these three components and given them specific weightings to create our own, proprietary complacency index. When our indicator flashes, it's time to get out of stocks... On average, stocks have fallen 26% five months after the signal hits.
Porter debuted this complacency indicator at our Stansberry Conference in Los Angeles last week. He showed the below chart...
 So what brought this study on?
The market was at all-time highs, the Volatility Index (the "VIX") – which reflects levels of investor fear – was scraping along the bottom... And nobody, save Porter, was worried about a correction.
But we wanted hard numbers – not just a gut feeling – that would show when the stock market is on the verge of collapse.
We wanted to know what the best indicator is for investor complacency... Would it be the VIX? The spread of junk bonds over Treasurys? Or maybe the number of days without a correction in stocks?
At the time, in early July, stocks hadn't had an official correction (a 10% decline) in 1,000 straight trading days... The streak has continued through today, with the S&P 500 sitting near its record high 2,000.
As we said... we found three indicators that, when assigned specific weightings, have accurately predicted the seven of the nine stock market corrections over the past 25 years. I can't share all the details of how we put this index together. It's far too valuable just to give away. This is the type of information banks and hedge funds would pay millions for... But I will share and explain the three indicators we've found to be the most accurate predictors.
Without further ado, the three components of our proprietary index are...| • | The yield curve |
| • | The TED spread |
| • | The put/call ratio |
We'll discuss each of these individually...
The yield curve shows the interest rates of bonds with equal credit quality, but different maturities. For our study, we used the 10-year Treasury yield versus the one-year Treasury yield.
Below, you'll see a chart of the yield curve for the past 10 years...
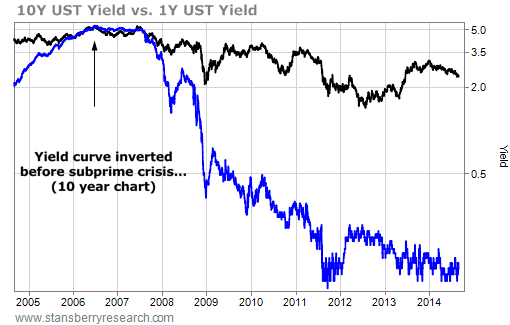 When stocks are doing well, investors demand higher rates for short-term bonds... It motivates them to move cash from stocks to bonds. Under normal conditions, long-term rates are higher than shorter-term rates. Though, as short-term yields rise, the difference (or "spread") between them grows smaller and smaller.
And, often before stocks peak, the yield curve will invert. Short-term yields will actually go higher than long-term yields.
This anomaly is a sure sign investors are far too comfortable in stocks. The yield curve has inverted before all U.S. recessions of the past 50 years. It's a powerful indicator on its own... But, we've improved the accuracy and lead time with the other components of our index.
Our second component is the TED spread...
The TED spread measures the difference between interest rates on the three-month Treasury and the three-month London Interbank Offered Rate (LIBOR) – the rate at which banks lend each other short-term money. This measure represents the perceived credit risk in our economy.
For this equation, T-Bills represent a risk-free rate. And LIBOR represents the credit risk a bank experiences by lending to another commercial bank.
The greater the spread between the two, the more perceived credit risk. A lower spread signals a decreasing concern for bank defaults.
The last measure we use for our complacency indicator is the put/call ratio...
Remember, a put option gives an investor the right to sell an asset (usually a stock) at an agreed-upon price (strike price) by a specific future date (option expiration). It's a bearish bet.
A call option is a bullish bet... It gives you the right to buy a certain stock at a specific price in the future.
When a higher number of put options are being traded compared with call options, investor sentiment is bearish. And vice versa.
When we assign specific weightings to each of these three indicators in our index, the results are astounding...
Going back 25 years, our complacency index has accurately predicted seven of the nine stock market corrections when it flashes "warning." And the average lead time was only five months before a substantial correction.
So how far away from a correction are we today?
Porter asked I keep the exact index readings private... He's going to share that with his readers in the future.
However, we can tell you our signs show smooth sailing ahead... Our complacency indicator hasn't yet tipped. But Porter will alert everyone when it's flashing red.
Changing gears, we've just started offering Early Bird tickets for our final Stansberry Conference of 2014 in Nashville, Tennessee... The date is October 18.
I'm sure Porter will update everyone on his timing indicator in Nashville... He has also promised to unveil the details of his newest business venture. It has nothing to do with finance... It's a consumer-products company.
He's going to discuss the idea behind the business, the financials, how he plans to market it... All the steps involved in making his new venture a success. It will be a crash course on entrepreneurism and evaluating great businesses.
In addition to Porter, we've also got former Congressman and presidential candidate Ron Paul... and Jim Rickards, hedge-fund manager and author of The Death of Money, is also speaking... Just to name a few.
Early Bird tickets are only $250... And once they sell out, we're raising the price. If you'd like us to reserve you a seat at our show in Nashville, send us an e-mail at events@stansberryresearch.com.
 New 52-week highs (as of 8/28/14): Apple (AAPL), Consolidated Tomoka (CTO), Dollar General (DG), Enterprise Products Partners (EPD), Energy Transfer Equity (ETE), Lynden Energy (LVL.V), ONEOK (OKE), PowerShares S&P 500 BuyWrite Fund (PBP), and ProShares Ultra 20+ Year Treasury Fund (UBT).
In today's mailbag... A subscriber shares his favorite market-timing indicator. Send your e-mail to feedback@stansberryresearch.com.
"I own a small investment management firm in Wisconsin. Being in this business for some 38 years, I've notice a sure-fire indicator.
New 52-week highs (as of 8/28/14): Apple (AAPL), Consolidated Tomoka (CTO), Dollar General (DG), Enterprise Products Partners (EPD), Energy Transfer Equity (ETE), Lynden Energy (LVL.V), ONEOK (OKE), PowerShares S&P 500 BuyWrite Fund (PBP), and ProShares Ultra 20+ Year Treasury Fund (UBT).
In today's mailbag... A subscriber shares his favorite market-timing indicator. Send your e-mail to feedback@stansberryresearch.com.
"I own a small investment management firm in Wisconsin. Being in this business for some 38 years, I've notice a sure-fire indicator.
"When the market has been undergoing some downward stress for a year or so (a few months doesn't work), there is ALWAYS a moment in time when we receive that all-important phone call from at least one client: 'Sell everything!'
"It's happened every time. Usually the market bottoms within 2 weeks of that phone call. (One particular client has done it twice!)
"Further, it can't be a 'let's reduce our equity holdings by X%.' That doesn't work. It has to be a 'sell everything' type of phone call. Even better if it's accompanied by hysterical emotion.
"It's gotten to be a joke around our office. We look forward to that type of phone call as it's a sure-fire bottoming signal – and it's been dead accurate each and every time. (One client, in March of 2009, hit the exact bottom within five days.)
"Can you beat that?
"P.S. The 'signal' doesn't work on the upside when the market is topping ('Buy everything?'). Too bad!" – Paid-up subscriber Gene Szaj
Regards,
Sean Goldsmith
August 29, 2014
This country will be the next big emerging-market story...
Back in March, S&A Global Contrarian editor Kim Iskyan traveled to Iran in search of potential investment opportunities.
In today's Digest Premium, he explains why Iran could be the next big emerging market. He also explains which types of companies will benefit if economic sanctions are lifted... And he reveals the name of the company he told his subscribers to invest in...
To subscribe to Digest Premium and receive a free hardback copy of Jim Rogers' latest book, click here.
This country will be the next big emerging-market story...
Editor's note: Back in March, S&A Global Contrarian editor Kim Iskyan traveled to Iran in search of potential investment opportunities. In today's Digest Premium, he explains why Iran could be the next explosive emerging market. He also explains which types of companies will benefit if economic sanctions are lifted... And he reveals the name of the company he told his subscribers to invest in...
At some point, Iran will be a very interesting market. Its stock market has a market capitalization of around $130 billion. That's larger than most emerging markets. It's also one of the world's cheapest markets, with a price-to-earnings ratio of less than six times.
The Tehran Stock Exchange hosts 300 actively traded stocks across 30-plus sectors. As you might expect, the companies with the largest market caps are energy-related.
Still, the market sees around $100 million in daily buying and selling activity, which isn't much. (To put it in perspective, shares of software giant Microsoft trade about $1 billion per day on the Nasdaq exchange.)
Iran has the world's second-largest energy reserves. But due to economic sanctions, it's illegal for Iran and its people to do business with the Western world.
The country's 75 million people haven't been able to buy Western toys or travel outside of the country in a generation and a half. You can't purchase a lot of common goods there, such as Coca-Cola or McDonald's... The television doesn't broadcast American channels like CNN... And if you're looking for a hotel, you won't find any of the ones you're used to in the U.S.
Iran can't import automobiles, so people are driving around old, beaten-up cars. A recent survey from the World Health Organization states that Iran boasts three of the world's 10 most-polluted cities. There is massive pent-up demand, and once sanctions are lifted, there will be a huge surge in growth.
Likewise, it's illegal for Westerners to invest in Iran, its stock market, or Iranian companies. So my challenge was to find a way to invest in a company that would benefit if sanctions on Iran were lifted. As I told my S&A Global Contrarian subscribers...
|
Because it's illegal for U.S. investors to buy Iranian stocks, I had to get creative. I had to look for companies on other exchanges that would benefit from doing business in Iran...
|
In the end, I found an energy company that does business in neighboring Turkmenistan: oil and gas firm Dragon Oil (LSE: DGO). The company has huge upside even if sanctions aren't lifted. Earlier this month, shares rose 5% after Dragon Oil posted solid first-half results. And as I told S&A Global Contrarian subscribers, there should be more gains to come...
– Kim Iskyan
Editor's note: In Kim's latest issue of S&A Global Contrarian, he shares his experiences from his travels to Kyrgyzstan – a tiny Central Asian country... And he tells readers about a tiny oil company operating in Argentina (and other, more stable countries). Shares recently got crushed due partly to the political turmoil and government default in Argentina. He says the stock has triple-digit potential as the market realizes the Argentine government will promote investment in its energy sector. You can learn more about S&A Global Contrarian and access Kim's latest report here...
This country will be the next big emerging-market story...
Back in March, S&A Global Contrarian editor Kim Iskyan traveled to Iran in search of potential investment opportunities.
In today's Digest Premium, he explains why Iran could be the next big emerging market. He also explains which types of companies will benefit if economic sanctions are lifted... And he reveals the name of the company he told his subscribers to invest in...
To continue reading, scroll down or click here.
Stansberry & Associates Top 10 Open Recommendations
(Top 10 highest-returning open positions across all S&A portfolios)
As of 07/21/2014
| Stock | Symbol | Buy Date | Return | Publication | Editor |
| Prestige Brands | PBH | 05/13/09 | 411.6% | Extreme Value | Ferris |
| Enterprise | EPD | 10/15/08 | 316.2% | The 12% Letter | Dyson |
| Constellation Brands | STZ | 06/02/11 | 310.5% | Extreme Value | Ferris |
| Ultra Health Care | RXL | 03/17/11 | 268.2% | True Wealth | Sjuggerud |
| Ultra Health Care | RXL | 01/04/12 | 222.2% | True Wealth Sys | Sjuggerud |
| Altria | MO | 11/19/08 | 210.2% | The 12% Letter | Dyson |
| Targa Resources | TRGP | 12/13/12 | 187.6% | SIA | Stansberry |
| Blackstone Group | BX | 11/15/12 | 179.1% | True Wealth | Sjuggerud |
| McDonald's | MCD | 11/28/06 | 178.1% | The 12% Letter | Dyson |
| Automatic Data Proc | ADP | 10/09/08 | 158.2% | Extreme Value | Ferris |
Please note: Securities appearing in the Top 10 are not necessarily recommended buys at current prices. The list reflects the best-performing positions currently in the model portfolio of any S&A publication. The buy date reflects when the editor recommended the investment in the listed publication, and the return shows its performance since that date. To learn if a security is still a recommended buy today, you must be a subscriber to that publication and refer to the most recent portfolio.
| Top 10 Totals |
| 3 | Extreme Value | Ferris |
| 3 | The 12% Letter | Dyson |
| 2 | True Wealth | Sjuggerud |
| 1 | True Wealth Sys | Sjuggerud |
| 1 | SIA | Stansberry |