
A Change of Character for the Market
New all-time highs for home prices... Sjug's latest thoughts on housing... More on earnings... A change of character for the market...
 It took more than a decade, but it finally happened...
According to a report this morning, the widely followed S&P CoreLogic Case-Shiller housing index – which measures prices across 20 major U.S. metropolitan areas – rose 6.8% year-over-year in February, for the 70th consecutive monthly gain.
This is the largest monthly increase in home prices in nearly four years, and well above the 6% average annual increase we've seen since prices bottomed in early 2012. And as you can see in the chart below, February's gains pushed finally pushed this index above its previous all-time high, set in July 2006...

Meanwhile, a separate report this morning from the U.S. Commerce Department showed new home sales continue to rise as well. Sales rose 4% in March, to an annualized rate of 694,000 units. This is the second-strongest monthly sales figure since before the market bottomed in February 2011.
In other words, despite the huge rise in housing prices over the past six years, the housing boom shows no signs of slowing...
In fact, it now appears to be accelerating to the upside.
Of course, this shouldn't come as a surprise to longtime readers. It's exactly what our colleague Steve Sjuggerud has been predicting again and again over the past few years.
Steve shared his latest thoughts on the housing market in our free DailyWealth e-letter last Thursday. In short, he remains incredible bullish today for one simple reason: Housing still isn't expensive yet. As he explained...
In the early 1970s, a typical new house in America was about 1,500 square feet. Today, a new house in America is about 2,500 square feet – 1,000 square feet larger than houses were 45 years ago. When you take this into account, you learn that house prices today – per square foot – are actually about the same as they've typically been over the last 45 years...
The median existing home price in America today is about $250,000. Meanwhile, the median size of a new home in America is roughly 2,500 square feet. So that math is easy – that's roughly $100 per square foot for the median house.
Forty-five years ago, the math is nearly identical (when you adjust for inflation). The median house size was just over 1,500 square feet. And the inflation-adjusted price of a home in the early 1970s was just over $150,000.
Here's what this measure looks like over the past 45 years:
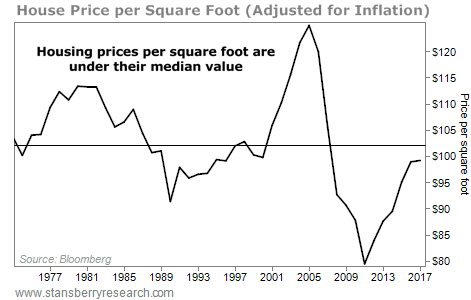
Steve says this chart tells him two important things...
First, given the extreme boom and bust last decade, we're unlikely to ever see a buying opportunity in housing as good as it was in 2011-2012. It was truly a once-in-a-generation opportunity... And hopefully those of you who were with us back then took Steve's advice at that time.
But Steve says the chart also tells him there's still plenty of upside left today...
Sure, house prices in America have run up – a lot – from the bottom. Even based on price per square foot, house prices are up nearly 25% from their lows in 2011. However, even after that run up, this measure is still below its long-term average.
Better yet, despite the run up in prices so far, Steve says housing remains incredibly affordable...
In fact, he says houses are more affordable today than just about any time in history. As he explained...
Consider the difference in 30-year mortgage rates today, compared with 1981:
No big deal, right? It's a different interest rate... so what.
It is a big deal. 1981 was the peak in mortgage rates. If rates were at 18.5% today, we'd be in trouble...
On a $250,000 loan at 4.4% interest, you would pay about $1,250 a month for 30 years. Over the life of the loan, you would pay about $200,000 in interest. On the same $250,000 at 18.5% interest, you would pay about $3,870 a month for 30 years. Over the life of the loan, you would pay $1.1 million in interest.
What's hard to imagine is that my parents actually would have paid those types of interest rates back then!

To Steve, the bottom line is simple...
Yes, housing prices have gone up significantly since 2012. But houses today still aren't that expensive... And when you factor in interest rates, housing is more affordable than ever. This means prices can continue to go much higher...
U.S. housing is not expensive, relative to history. In my opinion, we still have plenty of upside left.
I've put my money where my mouth is on this one... Florida real estate near the coast is still the biggest part of my own financial net worth (not including my home).
Yes, my friend, the housing market is hot. But no, it's not time to worry at all.
Yesterday, we discussed this week's busy earnings calendar...
In total, about 40% of the companies in the S&P 500 Index are scheduled to report first-quarter earnings this week. And expectations are high...
As we noted, nearly 20% of S&P 500 firms had reported to date. And the results were impressive: 72% have beaten sales expectations, while an incredible 80% have beaten earnings-per-share estimates.
Unfortunately, as we also mentioned yesterday, the market has largely shrugged them off so far. Shares of companies that have beaten expectations to date have risen less than 0.1% on average, according to Bloomberg. Meanwhile, companies that have missed estimates have lagged the market by nearly 2%.
And if this week's early reports are any indication, it's only getting worse.
Tech giant Alphabet (GOOGL) reported excellent results after the close last night...
It reported revenue of $31.15 billion, compared with expectations of just $30.29 billion, its strongest quarterly sales growth in four years. Profits were even better at $9.93 per share, compared with estimates of $9.28.
But the market wasn't impressed... Shares openly sharply lower this morning, and closed down nearly 5%.
It was a similar story with manufacturing-equipment giant Caterpillar (CAT)...
As regular readers know, Caterpillar is considered a bellwether of the global economy. When the world is growing, Caterpillar tends to do well. And on that note, its first-quarter results – announced this morning – did not disappoint. As the Wall Street Journal reported...
Caterpillar sales jumped 31% in the first quarter as the heavy machinery giant reported continued strength in construction and mining markets around the world.
The Deerfield, Ill.-based maker of bulldozers, mining trucks and other equipment boosted its profit outlook for the year, saying it could earn as much as $10.75 a share in 2018, $2 more than the upper end of its previous forecast...
"The strength in the global economy as well as favorable pricing for most commodities is benefiting many of our end-markets," said Chief Financial Officer Brad Halverson.
CAT shares initially traded more than 4% higher this morning. But the rally was short-lived... and shares closed down more than 6% today.
Of course, the financial media pointed to logical reasons for each of these moves...
In Alphabet's case, it cited rising capital costs. Most notably, traffic acquisition costs rose by 36% last quarter. For Caterpillar, it was a comment from the company's CFO indicating first-quarter earnings may be the "high-water mark for the year."
But as our colleague Scott Garliss noted on the Stansberry NewsWire this morning, Alphabet executives had already said these costs would slow significantly after the first quarter. And again, Caterpillar also raised its full-year profit outlook by more than 20%.
In other words, while each of these may be valid concerns, they appear to be relatively minor hiccups in otherwise excellent results... Yet each of these stocks fell significantly anyway.
It's still early... But this is a notable – and potentially important – change of character for the market.
Stay long... But keep a close eye on your stops, just in case.
New 52-week highs (as of 4/23/18): Okta (OKTA), Pioneer Natural Resources (PXD), and short position in Simon Property Group (SPG).
A quiet day in the mailbag. Surely, we've done something to upset you lately. Let us have it at feedback@stansberryresearch.com.
"It always amazes me when I see a message like the one from Robert S, accusing someone he doesn't even know of lies?! Why on earth would somebody who couldn't get filled at a particular time assume that 'nobody' got filled at that same time... surely he doesn't think the market was moving on hot air with no trade occurring on either side at all?!! It would be no different to calling someone a liar who managed to buy a washing machine at the local appliance store's January sale event, when someone else couldn't get one because they'd all sold out! Just because you couldn't get one, obviously doesn't mean NOBODY got one! Some people huh!" – Paid-up subscriber Julia R.
Regards,
Justin Brill
Baltimore, Maryland
April 24, 2018