
The Most Important Digest of the Year
The most important Digest of the year... The annual 'Report Card' is here... Why we're brutally honest... An urgent update on our Flex Alliance program... P.J. takes on Ted Cruz...
Editor's note: Be sure to read to the end of today's Digest for the latest installment from contributing editor P.J. O'Rourke, who discusses presidential candidate Ted Cruz.

![]() Below you'll find our most important Digest of the year. It's our annual "Report Card."
Below you'll find our most important Digest of the year. It's our annual "Report Card."
This is where I (Porter Stansberry) review all of our recommendations and assign a grade to each of our products. We've been publishing these comprehensive reviews for more than a decade... and yet... to my knowledge, none of our competitors has followed us down this path of radical transparency.
Frankly, we can't understand it. We can't imagine following a newsletter and investing our hard-earned savings without knowing the analyst's track record – in both bull and bear markets. As the founder of the business, I've always considered it my main job to make sure you get the information I'd want if our roles were reversed. It's a simple concept... but it has led us to do things that are profoundly different from what other publishers do.
![]() We're always brutally honest with our grades. This isn't Little League: Not everyone gets a trophy. Our analysts are extremely competitive guys. Some will be angry about their grades. But it's our duty to you – our readers – to always be open and transparent, even when the truth hurts.
We're always brutally honest with our grades. This isn't Little League: Not everyone gets a trophy. Our analysts are extremely competitive guys. Some will be angry about their grades. But it's our duty to you – our readers – to always be open and transparent, even when the truth hurts.
Our goal with measuring these track records is to determine the most "real-world" measurement of how our analysts have performed. Making a lot of good recommendations over 12 months during a raging bull market is hardly an accomplishment. Anyone could have done it. Thus, at the end of each year, we carefully choose a relevant period to review. We rate our analysts on how they perform over market cycles (bull and bear), not just a calendar year. This makes the review far tougher – and much more meaningful to our subscribers. Again, nobody else in the newsletter industry does anything like this.
![]() In last year's Report Card (which covered our performance in 2014), we measured our performance over the raging bull market in stocks that started at the end of 2011, following the European debt scare. It made sense last year to compile a bull market comparison. After all, since the beginning of 2012 stocks had been in a solid bull market, without any significant correction to prices. As the chart below shows, that's not true anymore...
In last year's Report Card (which covered our performance in 2014), we measured our performance over the raging bull market in stocks that started at the end of 2011, following the European debt scare. It made sense last year to compile a bull market comparison. After all, since the beginning of 2012 stocks had been in a solid bull market, without any significant correction to prices. As the chart below shows, that's not true anymore...
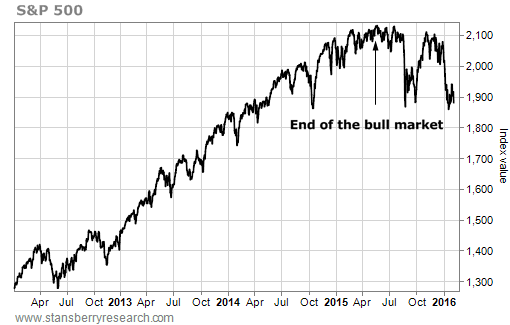
![]() For the first time in nearly four years, stocks experienced an official correction in 2015. The S&P 500 peaked at 2,130.82 on May 21, 2015. And it fell as low as 1,859.33 on January 20, 2016 – a 12.7% decline. In short, May 21 marked the end of the great 2012-2015 bull market. That allows us, for the first time in a long time, to make both bull market and bear market comparisons.
For the first time in nearly four years, stocks experienced an official correction in 2015. The S&P 500 peaked at 2,130.82 on May 21, 2015. And it fell as low as 1,859.33 on January 20, 2016 – a 12.7% decline. In short, May 21 marked the end of the great 2012-2015 bull market. That allows us, for the first time in a long time, to make both bull market and bear market comparisons.
Thus, this year, we'll show you an analysis of how our products performed during the big bull market of 2012-2015 and we'll show you how they've done since the emergence of a bear market. Sure, it would have been easy to "disguise" our bear market performance. We could have just tucked those picks away at the end of a long bull market. But that's not what we did.
Again, our mission here is to give you the information we'd want if our roles were reversed.
![]() For the bull market period, we compiled every recommendation each analyst made between January 1, 2012 and May 21, 2015. And we calculated their returns as of the market top. Then, we wanted to see how each analyst performed while stocks were correcting. So for the bear market period, we compiled each recommendation made between May 22 and December 31, 2015.
For the bull market period, we compiled every recommendation each analyst made between January 1, 2012 and May 21, 2015. And we calculated their returns as of the market top. Then, we wanted to see how each analyst performed while stocks were correcting. So for the bear market period, we compiled each recommendation made between May 22 and December 31, 2015.
![]() To use our Report Card, you need to know how we measure performance. We use two simple measures that everyone should understand intuitively. We show you each product's "win percentage" – that's how many of its recommendations went up. And we show you the average return. That's the simple average of each recommendation's performance, good or bad. We believe these numbers are important because we know that most subscribers aren't going to buy every recommendation. As a result, they need to know, on average, what to expect when they follow our advice.
To use our Report Card, you need to know how we measure performance. We use two simple measures that everyone should understand intuitively. We show you each product's "win percentage" – that's how many of its recommendations went up. And we show you the average return. That's the simple average of each recommendation's performance, good or bad. We believe these numbers are important because we know that most subscribers aren't going to buy every recommendation. As a result, they need to know, on average, what to expect when they follow our advice.
![]() We also use other measures of performance that are, frankly, harder to understand (unless you have a background in math). We publish annualized results, and we compare these with the "weighted return" of the S&P 500.
We also use other measures of performance that are, frankly, harder to understand (unless you have a background in math). We publish annualized results, and we compare these with the "weighted return" of the S&P 500.
Annualized results are simply the returns you would have gotten if you'd bought all of the recommendations and then began to reinvest your profits. It's the most "real-life" measure of an investment track record.
You might think that comparing these "real-world" results to the stock indexes is a simple matter – but it's not. You see, our track records don't start at a specific date. You can't compare my newsletter to the S&P 500 for the last four years because my recommendations didn't all begin four years ago. They evolved over the last four years.
To make a meaningful comparison, we have to figure out how each individual recommendation performed versus the S&P 500. Think about it this way. Every time we publish a recommendation, you have a choice. You could either buy our stock pick, or you could buy the S&P 500. If you bought the S&P 500 every time, your "weighted" S&P 500 results could be accurately compared to our annualized returns.
![]() The important part to realize is that since every product makes recommendations at different times (and in different amounts), each product's weighted S&P 500 "bogey" is going to be a different number.
The important part to realize is that since every product makes recommendations at different times (and in different amounts), each product's weighted S&P 500 "bogey" is going to be a different number.
Subscribers generally have a hard time figuring out why we use so many different weighted S&P 500 figures. And the answer is because every product is trying to beat a different version of the S&P 500's results. If you still don't get it, feel free to ask us a question (feedback@stansberryresearch.com). I'm happy to go into greater detail to explain our methodology.
![]() Now that you know what the numbers mean, let me show you how we use them to assign a grade. We evaluate each service on three metrics: winning percentage, average return, and annualized return.
Now that you know what the numbers mean, let me show you how we use them to assign a grade. We evaluate each service on three metrics: winning percentage, average return, and annualized return.
Everyone loves when an editor makes big gains for his subscribers. But big annual gains aren't the whole story... Our No. 1 responsibility as investment analysts is to avoid recommendations that lose money. So we believe an editor's ability to pick winners and avoid losers is the single most valuable factor. That's why we weigh winning percentage most heavily when assigning our grades. A higher winning percentage assures you that the recommendations you choose to follow are more likely to end up in the black. And when you find an editor who consistently picks winners – and those winning positions post outsized average gains – you should follow him.
![]() Now that you understand how and why we present our Report Card, let's get to the rankings. Today, we'll cover our monthly newsletters. And in tomorrow's Digest, we'll cover our more expensive trading services and Stansberry Venture.
Now that you understand how and why we present our Report Card, let's get to the rankings. Today, we'll cover our monthly newsletters. And in tomorrow's Digest, we'll cover our more expensive trading services and Stansberry Venture.
| The 2015 Stansberry Research Report Card – Bull Market | |||||||||
| Publication |
Win % |
Avg. Return |
Annualized Avg. Return |
S&P Weighted |
Grade |
||||
| Retirement Millionaire |
89.3% |
22.2% |
20.2% |
17.5% |
A+ |
||||
| Income Intelligence |
84.6% |
17.9% |
14.1% |
14.3% |
A+ |
||||
| Stansberry's Investment Advisory |
56.4% |
15.1% |
15.4% |
16.8% |
B+ |
||||
| Extreme Value |
53.3% |
14.1% |
10.4% |
23.6% |
B |
||||
| True Wealth |
48.0% |
14.6% |
15.5% |
18.8% |
B |
||||
| Stansberry Resource Report |
29.9% |
-7.0% |
-13.3% |
-15.3%* |
B |
||||
| * Based on the S&P GSCI Commodity Index | |||||||||
| The 2015 Stansberry Research Report Card – Bear Market | ||||
| Publication |
Win % |
Avg. Return |
S&P Weighted |
Grade |
| Retirement Millionaire |
50.0% |
-0.9% |
-2.4% |
B |
| Income Intelligence |
100.0% |
2.9% |
-3.1% |
A+ |
| Stansberry's Investment Advisory |
46.2% |
-3.7% |
-0.5% |
C |
| Extreme Value |
N/A |
0.0% |
0.0% |
A |
| True Wealth |
55.6% |
-1.5% |
0.2% |
B |
| Stansberry Resource Report |
43.8% |
-6.0% |
-22.9%* |
A |
| * Based on the S&P GSCI Commodity Index | ||||
![]() We'll discuss these grades (both bull and bear) below, in the order of bull market win percentage from best to worst. Not surprisingly, Doc Eifrig's products sit at the top of the heap. He won the bull market win percentage contest by a mile, making money on almost 90% of his recommendations!
We'll discuss these grades (both bull and bear) below, in the order of bull market win percentage from best to worst. Not surprisingly, Doc Eifrig's products sit at the top of the heap. He won the bull market win percentage contest by a mile, making money on almost 90% of his recommendations!
Retirement Millionaire: A+/B
Last year, I told Report Card readers, "There's no better investment advisory service [than Retirement Millionaire] anywhere in the world, at any price." This year, I have to modify that claim.
As you'll see below, Doc has beaten himself through an even better performance in his second newsletter, Income Intelligence. Nevertheless, Doc's performance in Retirement Millionaire has been incredible.
Doc earned an A+ for the 2012-2015 bull market. He had our best win rate, our highest average return, and our highest annualized return.
Doc's big winners included 74% on computer-networking giant Cisco, 62.7% on industrial manufacturer United Technologies, and 57.7% on insurance firm AFLAC. These are safe, "stodgy" stocks. But Doc picked them at the right times, resulting in "hot" stock performances. Despite the incredibly safe investment approach that Doc follows, his annualized results trounced the S&P 500 even during the raging bull market we saw between 2011 and 2015.
I can't emphasize enough how impressive Doc's performance has been. And... I expect that performance will actually get better, on a comparative basis, during this bear market. Doc's careful investing will really shine during tough periods in the market, like the one we're experiencing right now.
Income Intelligence: A+/A+
As you may know, Doc had a long and successful career on Wall Street as a derivatives trader for Goldman Sachs. Nobody else on our team has as much senior-level financial experience. And Doc continues to put his experience to work in ways that can be life-changing for the subscribers smart enough to stick with him and follow his often-contrarian advice.
What's so impressive about Doc's performance during the bull market in his Income Intelligence newsletter is that he almost beat the S&P 500. He did so with an 84%-win rate and while recommending the safest, income-producing assets across sectors – including a large allocation to bonds.
In other words, Doc is such a great investor, he nearly beat the stock market without even investing (for the most part) in stocks at all. A typical income-producing portfolio, especially one with a large allocation to bonds, wouldn't come close to matching the performance of the S&P 500. Investors normally have to forego capital appreciation for the safety of the yield. But not Doc.
Among Doc's best calls was his long-standing bullish position on municipal bonds. His most recent muni recommendation, from July 2013, earned subscribers a 22.2% capital gain with the Invesco Value Municipal Income Trust. Plus, investors collected a tax-free 6.7% yield (a tax-equivalent 10% yield) along the way.
In addition to muni bonds, Doc also recommended emerging-market debt, a timber-focused real estate investment trust (REIT), real estate companies, and high-quality equities, like asset manager AllianceBernstein and semiconductor maker Intel. The combination of super-safe, high-yielding stocks plus high-yielding bonds produced equity-like returns, without the normal risk and volatility of owning stocks.
That's an advantage every investor in the world should want. I urge you to consider reading Doc's Income Intelligence today. It is demonstrably our very-highest-quality monthly newsletter.
Stansberry's Investment Advisory: B+/C
Early in the last bull market, my team and I figured out that oil production was going to boom.
We were among the first analysts anywhere to predict oil would fall to less than $40 a barrel, and to anticipate a boom in oil production stocks. Liquefied natural gas exporter Cheniere Energy returned 76.9%, and energy infrastructure firm Chicago Bridge & Iron returned 77.5% in a little more than two years. And our position in pipeline company Energy Transfer Equity was up 138% at the market peak.
When oil prices began to collapse in late 2014, we sold these positions and began to recommend shorting stocks that were leveraged to high oil prices. Getting these trends right is what largely explains our positive results. On the flip side, our win percentage wasn't much better than 50%. And our annualized returns were not market-beating because we maintained a "hedged" portfolio throughout the bull market. Maintaining short positions helps our portfolio stand up better during market downturns. But it hurts our performance in a bull market like we experienced since 2012. I believe achieving a 15.4% annualized return with a hedged portfolio is a fantastic achievement. But we still underperformed the market, so we can't give ourselves an "A."
Ironically, despite our many short-sell positions, our performance since last May has not been marketing-beating either. Yes, we've done great on several short sales relating to the ongoing bloodbath in high-yield credit. But we got burned trying to catch a few of the "falling knives" in the resource sector – most notably, resource giant Freeport-McMoRan. We have also been frustratingly early with our short recommendation on Tesla. Our thesis has proven to be true – the stock is at new lows. But we were stopped out of the position, twice, with big losses.
As a result, our performance hasn't been up to snuff since the bear market began. I'm confident that we'll regain our footing and produce marketing-beating results through the rest of this year.
Extreme Value: B/A
The end of a long bull market is hard on value investors.
After stocks have risen for several years, without any corrections, there's not much left that's genuinely cheap to buy.
And showing incredible discipline, Dan stopped recommending stocks altogether until the market fell late in 2015. Specifically, Dan has only made one recommendation after May 2015.
In December, he recommended shares of gun maker Sturm, Ruger. It's impossible to assign Dan a bear market grade based on one recommendation that was only made two months ago. But we're giving him an "A"' anyway based on the discipline he showed during the late stages of the last bull market.
I hope you're impressed with how stubborn Dan can be as an investor. You don't get extra points for difficult investments, so Dan waits and waits and waits until he sees a "fat pitch" that he likes. Bear markets create opportunities for investors like Dan. I expect a slew of great recommendations from Extreme Value over the coming months. I'm sure he'll justify that "A."
Meanwhile, for the bull market, Dan's portfolio earned a "B" with a great average return and a respectable win percentage (over 50%). His performance, however, was hampered by some losing bets – notably, a long-held position in IBM and losses in oil stocks reduced his annualized returns.
We know that Dan's overall performance would have been greatly improved by the use of trailing stop losses (which we recommend). Dan, stubborn as always, has so far mostly refused to use these tools, which I believe he considers akin to "training wheels."
If you're looking for great performance, try pairing Dan's outstanding, deep fundamental research with 30% trailing stop losses. I'm sure you'll end up with A+ performance.
True Wealth: B/B
More than any analyst, Steve Sjuggerud did a great job of riding the bull market in U.S. stocks.
His "Bernanke Asset Bubble" thesis – correctly predicting massive quantitative easing would send stocks soaring – was right on the mark.
And True Wealth subscribers made huge money in the biotech boom, housing (as evidenced by a 251% return in Blackstone Group), and health care.
But he also took some lumps trying to call the bottom in gold stocks. And far too many times, he tried to time the bottom in emerging markets. Meanwhile, the strong dollar and crashing commodity prices sent emerging markets tumbling. Steve lost money on all eight of his emerging-market recommendations. That had a terrible effect on his win percentage, but didn't prevent him from earning good annualized returns because he continued to rigorously cut his losses.
Steve explained, "The lesson is to not force what is not there... Stick with what's working. You can't tell the market what it 'should' do."
So Steve only gets a "B" for the big bull market period because of his relatively low (48%) win percentage.
Meanwhile, Steve's diversification into gold is beginning to play a powerful role in protecting his portfolio during this ongoing bear market. I'd urge investors who are looking to hedge their exposure to stocks to watch Steve's move into gold carefully.
Stansberry Resource Report: B/A
These two grades – a "B" for the bull market and an "A" for the bear market – are sure to be my two most controversial ratings.
Matt Badiali, our lead analyst for the Stansberry Resource Report, has a terrible win percentage (30%/44%). His average returns are negative. And his annualized returns are negative. Investors who followed his advice lost money. So... how in the world can we give him a "B" and then an "A" grade?
Simple... Matt only writes about resources. You'll notice that we don't compare his results against the standard S&P 500 Index. Instead, we compare his results with an S&P index of commodity-related stocks. And commodities have been in a horrible bear market since 2012. Gold was down three years in a row (2013, 2014, and 2015). Oil is down more than 80% overall. Stocks in both sectors have been absolutely crushed.
Meanwhile, Matt's results weren't catastrophic. Since 2012, his letter's annualized results were only down 7%. That's not a wipeout. And since May 2015, the downturn in commodities got worse, but Matt has made a profit in almost half of his recommendations during the period. Once again, his losses (6% on average) are nothing like the index's losses (down 23%).
Matt gets good grades because relative to his sector, his results were great. Sooner or later, resources will bottom. When they do, we know that Matt will produce outstandingly positive results.
![]() Those are my grades for our "regular" newsletters. Tomorrow, I'll share the track records and the grades for our more expensive trading services, and our elite, small-cap research service, Stansberry Venture. Trust me, you won't want to miss the report on what Venture subscribers have been doing.
Those are my grades for our "regular" newsletters. Tomorrow, I'll share the track records and the grades for our more expensive trading services, and our elite, small-cap research service, Stansberry Venture. Trust me, you won't want to miss the report on what Venture subscribers have been doing.
![]() By the way... some of you, no doubt, are still wondering about the whole donnybrook that broke out last week when I complained about the actions of a few of our current Flex Alliance members. Some people, it seemed, took the program (which allows you to switch which five newsletters you're receiving) as an invitation to switch constantly and thereby gain access to all of our products.
By the way... some of you, no doubt, are still wondering about the whole donnybrook that broke out last week when I complained about the actions of a few of our current Flex Alliance members. Some people, it seemed, took the program (which allows you to switch which five newsletters you're receiving) as an invitation to switch constantly and thereby gain access to all of our products.
This behavior offended me. If someone invites you to share a pizza and says you can have any five slices you want and you respond by taking the entire pie... something is wrong. Incredibly, in my view, many subscribers thought I was the person acting immorally by taking sensible steps to prevent unlimited access to all of our products (rather than unlimited access to five of our products).
![]() My view on the matter hasn't really changed. But... I'm very reluctant to do anything, ever, that could damage the reputation of my company, even something as simple as closing a door on the hands of a few folks who are clearly abusing us. In the minds of some people, our efforts to prevent some Flex Alliance members from stealing from us constituted breaking our word. Again, I think that's completely absurd. But... I've learned that reputations are fragile things. I prefer to never be accused of bad faith. And so... we've decided not to change any of our policies in regards to the Flex Alliance. You may continue to switch your subscriptions, as many times as you feel is necessary.
My view on the matter hasn't really changed. But... I'm very reluctant to do anything, ever, that could damage the reputation of my company, even something as simple as closing a door on the hands of a few folks who are clearly abusing us. In the minds of some people, our efforts to prevent some Flex Alliance members from stealing from us constituted breaking our word. Again, I think that's completely absurd. But... I've learned that reputations are fragile things. I prefer to never be accused of bad faith. And so... we've decided not to change any of our policies in regards to the Flex Alliance. You may continue to switch your subscriptions, as many times as you feel is necessary.
![]() Why am I backing down? Because it's not worth the fight. It's a better decision for everyone if we just move on.
Why am I backing down? Because it's not worth the fight. It's a better decision for everyone if we just move on.
![]() New 52-week highs (as of 2/5/16): Invesco Value Municipal Income Trust (IIM), NovaGold Resources (NG), OceanaGold (OGC.TO), and AT&T (T).
New 52-week highs (as of 2/5/16): Invesco Value Municipal Income Trust (IIM), NovaGold Resources (NG), OceanaGold (OGC.TO), and AT&T (T).
![]() Do you disagree with my grades so far? I'm curious to hear your opinion. Let me know at feedback@stansberryresearch.com.
Do you disagree with my grades so far? I'm curious to hear your opinion. Let me know at feedback@stansberryresearch.com.
Regards,
Porter Stansberry
Baltimore, Maryland
February 8, 2016
Ted Cruz: Dreaming of 'Wacko Birds' and Flying Ponies
Ted Cruz is a dream candidate for anyone who wants to see America take great economic strides without being chased by the hounds of government and bitten in the seat of the pants.
Ted Cruz's plans are good. The Texas senator would:
| • | Institute an across-the-board flat-rate 10% income tax. And he wouldn't just chain up the IRS, he'd take it out behind the barn and send it the way of Old Yeller. |
| • | Get rid of the Housing and Urban Development (HUD) agency that might as well be called the Department of Homelessness and Abandoned Downtowns. |
| • | Cut the nation's power bill by turning off the lights at the Department of Energy. |
| • | Take a commercial approach to the Department of Commerce, which is not a going commercial concern and ought to go out of business. |
| • | Teach the Department of Education to say "Goodbye." |
Cruz has a list of government commissions to be decommissioned, government programs no one wants to see in reruns, and government bureaus to be locked in a bureau drawer.
His federal budget will have its books balanced by law. His Federal Reserve will have its currency supply governed by reason.
The trouble is, Ted Cruz's plans are too good.
We'd all be in love with a 10% flat tax. But could it wind up as a Romeo and Juliet love story?
The U.S. gross domestic product (GDP) is $16.8 trillion. The U.S. federal budget is $3.8 trillion. Let's imagine Cruz somehow lops $1 trillion off the budget. Let's imagine the 10% tax rate is somehow applied to the entire GDP. That gives us $1.68 trillion in revenue to cover $2.8 trillion in expenditures. We're still buried under a $1 trillion-plus deficit in a Shakespearean tragedy of a national debt tomb.
It's nice that our flat-tax forms will be the size of a postcard. But how does a piece of pasteboard (with a photo of the Treasury building on one side and "Weather is here, wish you were beautiful!" on the other) fund the Army, Navy, Air Force, and Marines?
Eliminating the IRS is an applause line for sure. But something else that's for sure – the government has to have some mechanism to collect taxes. Citizens aren't going to stroll by the White House and leave their tax payments under the windshield wiper of the presidential limousine.
Eliminating Energy, Commerce, HUD, and Education may be almost as hard to do. Ronald Reagan found this out. The Department of Education was only one year old, a toddler on the playing field of Washington influence when Reagan tried to tackle it and got stiff-armed.
Disposing of a cabinet-level department with all its prestige, patronage power, and budget earmarks means getting past entrenched interests. It's a deep trench those interests dig. And it's not just your opponents doing the digging. Members of your political family are also down there in the ditch wielding shovels.
When you try to take out the trash, you'll find a huge political pitfall in your own driveway keeping you from putting the Hefty bag full of useless federal agencies out on the curb.
The Department of Education had a budget of $14 billion when Reagan was elected. Thirty-five years, three Republican presidents, and several Republican congresses later... the Department of Education has a budget of $154 billion.
And good luck to Cruz with creating a rational system of monetary supply. Politicians like to feel that they "control" the economy. (Never mind that, in fact, the economy controls them.) Money is one of the main things that make politicians feel as if they're "in control." Politicians won't be enthusiastic about money they aren't in charge of any more than my teenager would be enthusiastic about getting the keys to a driverless car programed to take her to and from school and nowhere else.
For Cruz to make any of his plans happen, he's going to have to be a hell of a political salesman. He'll need to convince Congress to buy his ideas. And Cruz has – to put it politely – an "adversarial" personality.
This is not the best trait for a salesman. When a customer comes into your menswear store, you don't call him a wimp for buying briefs instead of boxers, tell him he's too fat to wear plaid, and announce that he'll never be able to pay his credit-card bill.
But Cruz called Republicans who voted with Obama on bipartisan measures "the surrender caucus." And despite strong GOP House and Senate opposition to gun control, Cruz referred to his fellow party members as "squishes" on the issue. Then, Cruz wondered aloud if outgoing House Majority Leader John Boehner had "cut a deal with Nancy Pelosi to fund the Obama administration for the rest of time."
A majority of people in Congress don't like Cruz. What's worse, that majority is the majority. The people in Congress who like Cruz least are the Republicans.
Cruz accused Senate Majority Leader Mitch McConnell of telling a "flat-out lie" about McConnell's intention to reauthorize the Export-Import Bank of the United States. A hundred years ago, that would have resulted in pistols at 20 paces on the Capitol lawn. As it was, it resulted in Senator John McCain getting right up in Senator Cruz's face, calling him a "wacko bird."
Former Senate Majority Leader and 1996 GOP presidential candidate Bob Dole told the New York Times that if Cruz is the Republican nominee, "we're going to have wholesale losses in Congress and state offices" and Hillary Clinton would "win in a waltz." Dole went on to say Donald Trump would make a better president than Cruz because Trump could "probably work with Congress, because he's, you know, he's got the right personality and he's kind of a dealmaker."
Ted, it's not a good sign when a guy like Dole compares you and a guy like Trump, and you come off as the loudmouth bully and existential threat to the Republican Party.
Cruz is a dream candidate. But while we're dreaming of economic flying ponies, unicorns, and candy-flavored rainbows... we don't want to wake up to find a liberal Democrat in the Oval Office.
Regards,
P.J. O'Rourke
|