
Why There Could Be Further Downside Ahead
Why there could be further downside ahead... The 'clock' is ticking for the next correction... Global stocks could be sending a warning... But don't get too bearish yet...
 Last week, we reviewed the bullish case for U.S. stocks...
First, a number of different momentum, sentiment, and "breadth" indicators have now reached extremes that typically occur at or near a meaningful bottom in the market.
Second, as we've discussed many times, the most reliable long-term equity, credit, and economic indicators we follow continue to paint a positive picture today.
In short, the data continue to suggest this is simply another correction in the ongoing bull market, rather than the start of a more serious bear market decline.
However, we also warned you that we couldn't rule out further downside in the near term...
That's because these indicators are not precise market-timing tools. History shows similar extremes sometimes show up weeks or even months before the market's final bottom.
Meanwhile, regular Digest readers will recall that our proprietary complacency indicator was triggered last month. As Stansberry's Investment Advisory senior analyst Brett Aitken shared in the September 11 Digest...
One of our key proprietary indicators just flashed a major warning signal that a correction could come within the next 12 months.
We back tested 25 years of data and found that when the score dropped below 30, it signaled a market correction of 10% or more over the following 12 months...
This month, the indicator dropped to 23. And it moves our primary indicator from "Neutral" to "Bearish."
While we consider this our primary sentiment indicator for the market as a whole, we can't know exactly when the correction will arrive. [But] based on almost 30 years of history, it will be in the next 12 months.
As Brett noted at the time, this indicator has been remarkably prescient...
It has predicted eight of the past 10 corrections of 10% or more. More important, while it hasn't predicted every correction, it hasn't produced any false signals. Every time this indicator has dropped below 30, the broad market has declined at least 10% over the next 12 months.
The previous signal was no exception. Regular readers may recall it was triggered last August... Less than six months later, stocks plunged more than 10% in February's "volatility panic."
Again, this indicator can't tell us exactly when a correction will occur...
Only that it will happen within 12 months. But here's what we do know...
As of last month, the "clock" is officially ticking again. And through last Thursday's low, this current sell-off has seen the S&P 500 fall roughly 5% from all-time highs.
In other words, if this is the correction, it's likely not over yet.
But this isn't the only evidence that this sell-off could have further to run...
Earlier this summer, our colleagues Ben Morris and Drew McConnell highlighted a divergence between U.S. and non-U.S. stock markets. As they noted in the June 25 issue of DailyWealth Trader...
For non-U.S. stocks, we'll use the Vanguard FTSE All-World ex-US Fund (VEU). It is the largest exchange-traded fund dedicated to diversified non-U.S. stocks. It holds stocks from more than 40 different countries, with larger weightings in developed markets and smaller weightings in emerging markets.
In the chart below, you can see that for two and a half years, VEU has traded mostly in line with the U.S. benchmark S&P 500 Index. But the two have moved in different directions since early May...
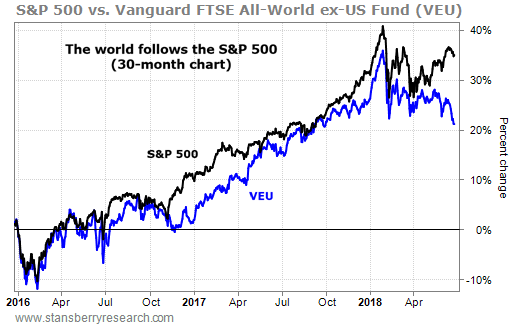
Typically, these divergences resolve with one group of stocks playing 'catch up' with the other...
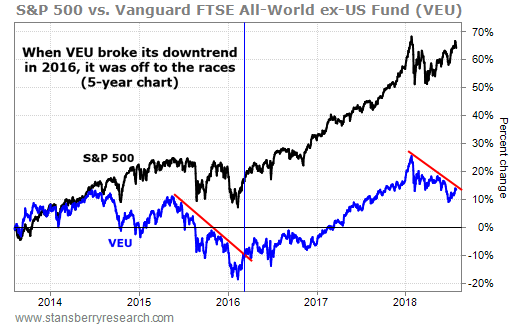
That's exactly what happened the last time we saw a similar situation in late 2015. Like today, non-U.S. stocks had dramatically underperformed U.S. stocks for months. But they eventually broke out of their downtrend and followed U.S. stocks higher for most of the past couple years.
Given the positive long-term indicators we mentioned earlier, we believed this divergence was likely to resolve the same way.
Ben and Drew agreed. In fact, just one month later, they noted that non-U.S. stocks appeared to be close to another bullish breakout. As we shared in the July 31 Digest...
In the chart below, you can see that early-2016 breakout. U.S. stocks hit a new all-time high and soared shortly after. You can also see that the markets are in a similar situation today. U.S. stocks are near new highs. And VEU is close to breaking out of a downtrend...
Unfortunately, that hasn't been the case so far...
Instead, the opposite has been playing out. As you can see in the updated chart below, U.S. stocks have been following non-U.S. stocks lower...

To be clear, this chart doesn't mean U.S. stocks will fall as far as non-U.S. stocks. These markets tend to move in similar directions, but they don't trade in lockstep. However, it does suggest U.S. stocks could fall another 10%-15% before bottoming.
A decline of this magnitude would be jarring for many folks...
But it wouldn't be all that unusual.
Given the remarkable calm of the past couple years, you may not remember that the S&P 500 has fallen 15%-20% on three different occasions since this bull market began.
This could happen again.
But we'll also remind you that none of those corrections marked the end of the bull market. Instead, each of those represented a buying opportunity as the market recovered and went on to new highs.
This, too, could happen again, which is why we'll continue to give this bull market the benefit of the doubt as long as the evidence supports it.
In fact, if our colleague Steve Sjuggerud is right about the "Melt Up," the next rally could be one for the record books... And anyone standing on the sidelines during the final weeks and months of this historic bull market could miss out on potentially life-changing gains.
That's why Steve is hosting a free Melt Up event on Wednesday, October 24 at 8 p.m. Eastern time. He'll offer his latest update on the Melt Up, and he'll even share the name and ticker of one company that he believes could return 1,000% during the Melt Up for free, simply for attending. You won't want to miss out on this incredible event. Click here to save your seat.
New 52-week highs (as of 10/12/18): none.
Well, it appears most Digest readers are weathering the recent volatility just fine. How are you doing? Let us know at feedback@stansberryresearch.com.
"This may be the start of another correction, which is not surprising to me considering how the Complacency Indicator dipped below 30 back in September (I remember that headline in that Digest: 'A Market Correction is Imminent.') As you have pointed out countless times: Stay Long... WATCH YOUR TRAILING STOPS... I'll be sleeping well tonight, thanks to you people at Stansberry Research. Cheers." – Paid-up subscriber Jose T.
"Just wanted to pass along some info on the short-term performance of my own portfolio. I glanced at my spreadsheet Thursday evening, and it said I was down around 1.2% on the day (when the market was down > 2%). Glanced at it again, mid-day Friday, and I was up a little more than the market. Better on the way down, and better on the way up. I'll take that.
"I'm in a bunch of Melt Up positions (I think of them as rocket fuel), some covered calls on boring companies (Retirement Trader), a few bonds and utilities, and some almost-permanent positions (some are Extreme Value, some are mine – I think of them as 'ballast') like Microsoft, UPS, and McD's. A few Big Trade options. Plus about 20% in a combination of cash and gold. Thanks for the help." – Paid-up subscriber David B.
"I'm sure Mr. Brill has heard this before, but on the off chance that some haven't, here goes: I slept like a baby [last week]. Every few hours, I woke up crying at night or screaming for milk." – Paid-up subscriber Richard C.
Regards,
Justin Brill
Baltimore, Maryland
October 15, 2018