
You're Not Alone...
If you're confused, you're not alone... More on today's uncertain markets... Two charts to help you get your bearings... 'Take a breath of fresh air'...
 The outlook for the markets today is as uncertain as any time in recent memory...
Regular Digest readers know we've documented plenty of reasons for optimism in recent months: The U.S. economy continues to grind higher... the tax and regulatory environment is as good as it's been in years... corporate earnings are solid... the market's long-term "vital signs" remain healthy... and investor sentiment remains relatively muted... just to name a few.
This suggests the long bull market could continue, as our colleague Steve Sjuggerud has predicted.
Likewise, we've covered plenty of reasons for concern: Corporations, consumers, and even the government itself have binged on record amounts of debt... the broad market is more expensive than almost any other time in history... the Federal Reserve is withdrawing its unprecedented stimulus for the first time since the financial crisis... and long-term interest rates are now moving higher as inflation stirs for the first time in years.
This suggests a serious financial reckoning is approaching.
Given these conflicting signals, it's no surprise the market has become incredibly volatile of late...
Our colleagues Ben Morris and Drew McConnell put these recent moves in perspective for their DailyWealth Trader subscribers this morning...
The markets are sloppy... Over the past month, the benchmark S&P 500 Index traded as low as 2,554 and as high as 2,717 – more than a 6% range. But it closed yesterday within 1% of where it traded a month ago.
And these past 21 trading days (the average number in a month) have shown us a lot of personalities. We've seen single-day gains and losses as large as 1.7% and -2.2%, respectively. We've seen big rallies followed by sharp drops, sharp drops followed by big rallies, and choppy up and down action with no direction or reason.
These moves have left many folks – even professional investors – scratching their heads...
If you're among them, read on.
You see, Ben and Drew also shared two simple charts to help their subscribers navigate this uncertainty. And they've graciously allowed us to share it here today. More from the issue...
Our first chart shows the S&P 500's long- and medium-term trends... Regular readers are familiar with the 200-day moving average (200-DMA) and the 50-day moving average (50-DMA).
The 200-DMA works by collecting an asset's closing prices from the past 200 trading days (about 10 months), then taking the average of those prices. This produces a chart line that "smoothes out" volatility and gives us a good measure of the market's long-term trend. The 50-DMA works in the same way. But because it averages just 50 days of trading – a little more than two months – we use it as the medium-term trend.
With all moving averages, we gauge strength and weakness in two ways...
First, when the asset trades above and below its moving average, it's a sign of strength and weakness, respectively. And second, if the moving average itself is moving higher or lower, the asset is in an uptrend or downtrend, respectively.
In the chart below, you can see that the S&P 500's 200-DMA is rising and its 50-DMA is flat. The S&P 500 trades right between its long- and medium-term trend lines...
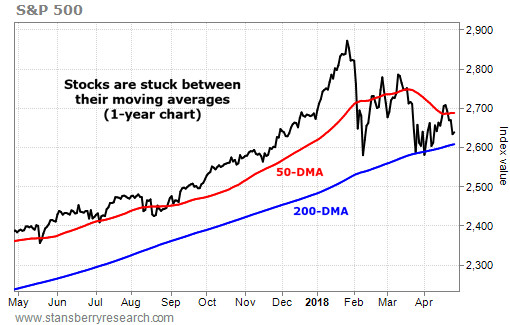
In short, this chart tells us the long-term trend is still up...
Despite the recent volatility, the S&P 500 continues to trade above its 200-DMA. We're still in a bull market.
That's the good news... Unfortunately, the intermediate-term picture isn't as bullish. As they explained...
Our next chart shows a chart pattern that traders often call a "triangle"...
So far in 2018, stocks have risen and fallen within a narrowing range. The latest two peaks have each been lower than the first one. And the two lows are each at the same level.
The key resistance level (the top line) is near 2,700. And the key support level (the bottom line) is near 2,580. Right now, stocks are trading near the middle of that range, at 2,640...
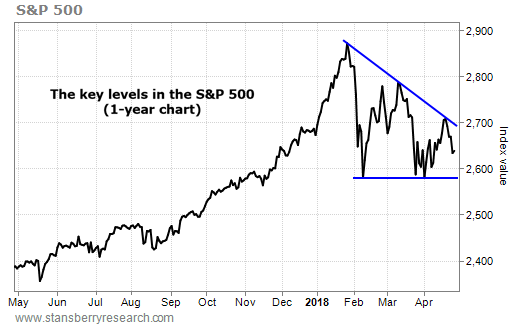
This chart tells us stocks have no clear direction right now...
This suggests the recent volatility could continue. Like us, they recommend taking a cautious approach until the market makes a decisive move in either direction...
For your current holdings, we suggest holding on and sticking to your stop losses... without hesitation. If the market tells you it doesn't like your trade (by triggering your stop loss), get out.
For new trades, you may want to reduce your position sizes to reduce your risk. And you should only put your money into high-conviction ideas. If the idea isn't great and the reward-to-risk setup isn't great, don't trade it.
In DailyWealth Trader, we also like the idea of selling puts rather than buying shares outright. This way, you'll lower your cost basis if you're assigned shares... reducing your risk. And because you earn cash up front, you can profit on the trade even if the stock doesn't rise.
To be clear, in DailyWealth Trader, Ben and Drew focus primarily on intermediate-term trades...
These are trades that typically last a few months to a year at most. But there's no reason long-term investors can't use this strategy, too...
Stay long, but keep a close eye on your stops. Be conservative with new investments. And wait for further confirmation before adjusting your approach...
If the S&P 500 breaks below its 200-DMA and then through its 2018 lows, we could see much lower stock prices in a hurry. That's why you need to stick to your stop losses.
On the other hand, if the S&P 500 can break through 2,700, the bulls will be back in control. The triangle pattern above will "resolve" to the upside... meaning higher prices are likely. And both the long- and medium-term trends will align... also supporting higher prices.
Traders often don't like to sit around and wait. But that's the best approach right now. The markets are sloppy. And the direction of the next big move isn't yet clear. Take a breath of fresh spring air. And wait for the market to tell you how to trade.
New 52-week highs (as of 4/25/18): Pioneer Natural Resources (PXD), W.R. Berkley (WRB), and short position in Simon Property Group (SPG).
Praise... vitriol... and paranoia... Today's mailbag has it all. As always, send your notes to feedback@stansberryresearch.com.
"Well, at least you're honest about not knowing, predicting the market is like predicting a jury's verdict before court adjourned, anyone who gets upset about not having a specific answer means their [life] is indecisive and always looking for someone to make their decisions for them. I like [that] you give us both sides of the coin... [At least] we know it's not two-headed." – Paid-up subscriber Tony W.
"You may be wrong but you're never in doubt. The market can go either way, but once it happens you'll bring up the correct option. Takes a certain amount of brass to have the ability to never be embarrassed. So scam away. It is what you do best. [I] won't be fooled again." – Paid-up subscriber Bob M.
"Your team can make recommendations, but the responsibility for taking action is all mine. I just read your April 25 Digest. I'm really glad you brought Greg [Diamond, editor of Ten Stock Trader] on board. I'm no technical analyst, but before making any bet I look at the chart to see if the timing looks reasonable. No matter how good a company performs, if it looks like the stock may drop, I just wait awhile to see what happens. I can always buy it later and if it really takes off the buy up to price doesn't make much difference; I lose a bit of the profit at the cost of taking less risk.
"I draw lines on the charts a bit different than Greg does and to me it looks like things are going to be pretty bad at least in the near term. For the next month I will be travelling and communications will be spotty at best. So I've pared my portfolio down, most for a nice profit, to 3 positions and will probably close them out in the next few days. If I'm wrong I can buy back in when I get back, but I won't get wiped out like 2008. Like my grandma always said, 'You pays your money and you takes your chances.'" – Paid-up Stansberry Alliance member E.T.H.
"Am wondering if you folks can post some info about how the Federal Reserve is going to/already started to freeze accounts, and then steal the money in those accounts? This keeps me from getting involved in investing (which I know nothing about) and I don't think anyone wants to invest if they have to concern themselves with being robbed if they get money to come back from investing.
"And who gave them the legal right to take from the accounts... and for what reason? The Fed/Imf/Nwo are all illegal, immoral, and unethical... so why does everyone who has some authority just sit on their butts?
"These groups are nothing but treasonous and are trying to stop our usage of our dollar/currency. So why doesn't Trump just write an Executive Order to put an end to all three of these Swamp-slime? I can't function with this investing and knowing that I will lose what I gain. Please advise. Thanks." – Paid-up subscriber Phil O.
Brill comment: Sorry Phil, we have no idea what you're talking about. But frankly, the notion is absurd. Don't get us wrong... We're certainly no fans of the Federal Reserve. But why would it go to the trouble of stealing your savings directly… when it can simply steal it through currency debasement as it has for the past 100 years?
Regards,
Justin Brill
Baltimore, Maryland
April 26, 2018