
Ignore This Stock Market 'Bogeyman'... Stocks Are Headed Higher
Editor's note: Stocks are headed higher.
Longtime Digest readers have heard it before. But Steve Sjuggerud has even more proof.
Today's Masters Series originally appeared in the August 22 edition of our free DailyWealth e-letter and the August 23 True Wealth Systems Review of Market Extremes.
In it, Steve explains why one "warning sign" in the market isn't worth worrying about... and discusses why history suggests stocks have more upside ahead...
Ignore This Stock Market 'Bogeyman'... Stocks Are Headed Higher
It's official – investors have borrowed more cash than ever to buy stocks...
We're talking nearly $600 billion borrowed "on margin" – when you add up the margin debt on the New York Stock Exchange (NYSE) and Nasdaq stock markets.
It's more money than investors borrowed at the peak of the dot-com boom in 2000. And more money than the 2007 peak just before the global financial crisis.
That sounds scary, right?
Many "experts" who are looking for a reason for the market to go down might point to it as a sign of the top. But is it something to worry about? Let's take a look...
This chart shows the NYSE's margin debt versus the S&P 500 Index. You can see that we're now at an all-time high... above previous highs when stocks peaked in 2000 and 2007.
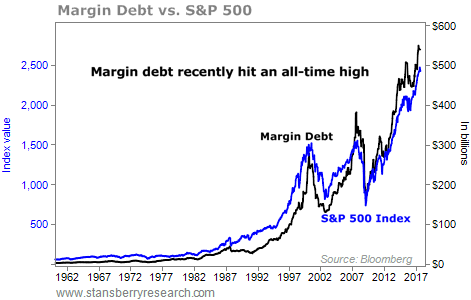
At a glance, you might think that the high margin debt could have caused those crashes... or made them worse. But that's not really the case.
Let's look at it another way to see it more clearly...
Here's a chart of the annual change in NYSE margin debt.
You can see that the use of debt to buy stocks spiked right around the market peaks in 2000 and 2007. And it bottomed out two years later.
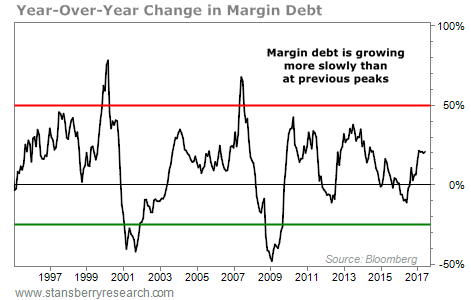
Those two peaks in the yearly change in margin debt are much better indicators of danger than what you see in the first chart. (And those bottoms in 2001 and 2009 would have been much better buying opportunities.)
That's not quite enough to go on as a trading strategy. But this chart does tell us that we don't need to worry about margin debt (at least not yet). As you can see, today's reading is nowhere near the last two peaks.
Another way to look at total margin debt is relative to the total size of the market.
Margin-debt levels have historically fluctuated between 1% and 2% of the overall value of the stock market. Those percentages don't move around much, even though the actual overall margin debt goes up and down.
Right now, while margin debt is at an all-time high, we're still at a less than 2% margin on the overall market.
In short, margin debt is high. But by itself, that's no reason to sell U.S. stocks. It's not a sign of danger – yet.
Many investors are scared of the markets right now. They're looking for any excuse to sell. Margin debt will be one of their excuses.
Don't believe 'em. You now know the real story...
A Green Light for U.S. Stocks
The U.S. stock market had a rough day last week...
All 30 stocks in the Dow Jones Industrial Average closed down Thursday. That's not something we've seen often in recent years.
It has been nearly a year since every stock in the Dow fell on the same day. Surprisingly, this rare extreme doesn't spell doom for the market.
In fact, history says this is an opportunity to "buy the dip." Since 2008, the Dow has typically returned 9.5% a year after similar extremes.
Let me explain...
Buying the Dow is an easy way to diversify your portfolio. It's a basket of 30 large-cap U.S. businesses that gives you exposure to the various sectors of the overall market.
When the benchmark S&P 500 Index goes up, the Dow almost always does as well. In other words, the Dow IS the market for U.S. stocks.
So what do we make of all 30 stocks in the Dow falling at the same time? Is this a sign to sell and run to "safe haven" assets like gold or U.S. Treasury bonds?
Based on history, that's not the right decision... You see, looking back to 2008, the Dow goes on to outperform its "buy and hold" return after all 30 stocks fall on the same day.
This last happened in September 2016... And stocks are up 24% since then. Take a look...

The recent extreme created a lot of buzz. It's scary without context. But history says you shouldn't worry... When all 30 stocks in the Dow fall on the same day, the index tends to move higher over the next year. Take a look...
|
|
6-Month |
1-Year |
|---|---|---|
|
After extreme |
2.1% |
9.5% |
|
All periods |
3.1% |
6.2% |
Since early 2008, the Dow has returned roughly 6% a year. But it has performed much better after all 30 stocks fell on the same day...
Similar extremes led to a slight underperformance after six months. But since 2008, on average, we've seen a dramatic outperformance after a year... with typical returns of 9.5%.
In short, all 30 stocks in the Dow falling in one day seems scary... But it isn't something to fear. Based on history, it's an opportunity to "buy the dip."
We remain bullish on U.S. stocks today. We'll move along when the trend breaks down. But that's not happening today.
So for now, our advice remains the same: Stay long U.S. stocks.
Good investing,
Steve Sjuggerud
Editor's note: The stock market is already up 9% so far this year. But about half of Americans are STILL sitting on the sidelines... while the other half gets rich. Are you missing out on the big gains from the Melt Up? Don't let the opportunity of a lifetime pass you by. Steve just put together a radical plan to help you make up for lost time. Learn more here.