
The Stock Market 'Melt Up' Chorus Grows
Editor's note: Longtime Digest readers know our colleague Steve Sjuggerud has been calling for a "Melt Up" in stocks for more than two years.
But it wasn't until recently that other highly regarded investors joined in on the growing Melt Up chorus.
In today's Masters Series essay – adapted from the January 8 and January 16 editions of our free DailyWealth e-letter – Steve clears up some confusion and explains why the Melt Up could continue on to 2020...
The Stock Market 'Melt Up' Chorus Grows
"Welcome to the Melt Up."
That was the title of a speech I gave to hundreds of our best customers at our Las Vegas conference back in 2015.
My story was simple. Stocks were about to go higher than most investors could possibly imagine.
That conference was more than two years ago. I've been writing about the "Melt Up" almost nonstop since then.
In recent weeks, many famous Wall Street experts have started calling for a Melt Up in stock prices... including one of the true greats...
"GMO's Jeremy Grantham Says Stocks Could Be Heading for a 'Melt-Up'," Bloomberg reported last month.
That story must have struck a nerve. Friends from all over the world e-mailed me to ask, "Did Jeremy Grantham steal your Melt Up thesis?"
I appreciate friends (and subscribers!) having my back – knowing that I was probably the first one regularly writing about the likelihood of a Melt Up in U.S. stocks.
And I'm flattered that people think Grantham "stole" my idea. But the reality is, when it comes to bubbles and melt ups, few people know more than he does.
If you want to learn more about today's Melt Up relative to previous stock market bubbles, I strongly urge you to read a paper Grantham put out last month...
In that paper, Grantham says he knows that prices are high – but high prices aren't what kill a bubble. He writes...
Indicators of extremes of euphoria seem much more important than price... Not nearly enough signs of euphoria [are] yet present to make this look like a late-stage bubble.
He then details several of his early warning indicators... which are similar to the early warning indicators I've written about (like the advance/decline line, a measure that shows if more stocks are going up than down).
Grantham makes the case that the stock market could reach bubble proportions later this year, or into the next...
He put specific numbers and dates on it (which is always dangerous to do!). He said:
A range of 9 to 18 months from today and a price rise to around 3,400 to 3,700 on the S&P 500 would show the same 60% gain over 21 months as the least of the other classic bubble events.
He concluded by saying, "A melt-up or end-phase of a bubble within the next 6 months to 2 years is likely." And if the Melt Up does arrive, he says the odds of a subsequent "Melt Down" are "very, very high."
I agree.
I expect that you will hear a lot of talk about bubbles in the next two years. Most of the folks talking will have no idea what they're talking about.
Jeremy Grantham, on the other hand, knows bubbles as well as anyone ever has.
If you want to learn more about today's Melt Up – and the potential subsequent bubble – I highly recommend reading his research paper on the subject called "Bracing Yourself for a Possible Near-Term Melt-Up."
Thanks again to friends who came to my defense as a lot of new voices are talking about a possible Melt Up. Some of those experts may have borrowed my work. But I doubt Grantham did... On the contrary, I've learned more from him about bubbles than just about anyone.
You should learn about bubbles from him, too...
All Right, Mr. Melt Up... So When Does It End?
"The great bull market in stocks that started in 2009 will ultimately end in a dot-com style Melt Up," I explained back in October 2015. Since then, I have hammered that theme home.
Nobody's cared – until lately.
Here in 2018, it seems, all the Wall Street experts are getting on board with my Melt Up idea.
Investors are now asking me when it ends. Here's my take...
Long story short, we still have time. The ultimate market peak might not arrive until 2020. No kidding.
I like to give you simple explanations and simple answers, when I can. And I like to boil things down to one indicator for you to keep your eyes on, when I can.
It's a bit harder with this question, but it's still doable. Here's the answer:
Over the past 30 years, the Federal Reserve has caused the three major peaks in the stock market...
Specifically, the Fed artificially caused a situation called an "inverted yield curve." Once that happened, the market peaked more than 18 months later. Each time.
The reason is simple... You see, an inverted yield curve happens when short-term bonds yield more than long-term bonds. Normally, the reverse is true. Long-term lenders are taking on more risk, so long-term bonds tend to pay more in interest. When the opposite happens, it's a bad sign.
Investors will debate endlessly over the causes of the peaks... Valuation... debt... stupid politicians... But when you crunch the numbers, it turns out the inverted yield curve has predicted stock market peaks better than any of these things.
Take a look at the spread between the 10-year Treasury bond yield and the two-year Treasury bond yield. Going back to about 1985, each time the black line initially crossed below zero (causing an inverted yield curve), the stock market peaked more than 18 months later...
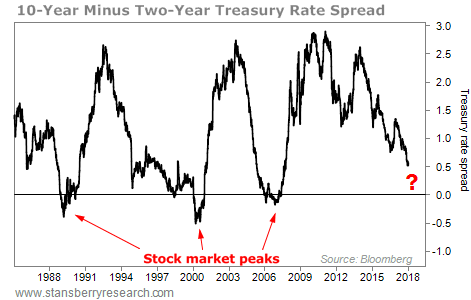
This is what happens when the Fed pushes short-term interest rates above long-term rates.
For more than a decade, we've been "in the clear" on this indicator. But last week, the interest rate on two-year Treasury bonds shot up above 2% for the first time since the financial crisis. That caused the line in this chart to accelerate toward zero.
Once it hits zero, the clock starts...
However, the last three times the line has hit zero, it took more than 18 months for the stock market to peak.
If it takes another six months for the line to cross below zero, and then about 18 months for the market to peak, that puts us into the year 2020.
While the stock market peak could be pushed out to 2020 based on this one simple indicator, it doesn't mean things aren't risky...
For me, as soon as that line hits zero, I'll start making some changes... tightening my trailing stops... and preparing for the end of the bull market.
People have been poking me in the chest lately, saying, "All right, Mr. Melt Up... what's it gonna be now?"
It's hard to boil down a lot of moving parts into one signal to watch. This one indicator is the best I've got to help you plan for the end of the Melt Up...
Good investing,
Steve Sjuggerud
Editor's note: If you feel like you've missed out on the biggest gains in the bull market, you're in luck... Steve says the biggest gains have yet to come. That's why he has assembled a portfolio that he believes will return 65% in just SIX MONTHS. And right now, he's making a ridiculous guarantee. Learn more about the Melt Up – and what will happen if Steve doesn't hit his investment target – right here.